
Too much inflation can cause many problems, and can even bring down a society/nation.
Milton Frieman said that inflation is a disease, and that inflation is always everywhere a monetary phenomena, the result of too much money. It is more complicated than just about money. Other factors such as innovation, natural disaster, forces of nature, wars, and so on can all play important roles.
We had lived in a world with low inflation in the US coming out of a decade of less than 2.5% YoY inflation rate. China inflation rate is less than 4%, India 6%, and Japan only at 0.5%. It is hard to imagine how inflation possibly could get any worse than the current +7% in the US, and 5.8% in Europe (average) in the West. But it very well likely can.
Without referring to any specific hyperinflation country current or in history, it is worth nothing that one of the worst inflation that affected the US and most of the world is the 1970s.
The graph shows that most of the world has double digit annual inflation rate in the 1970s (note that China and the then-USSR were not measured)
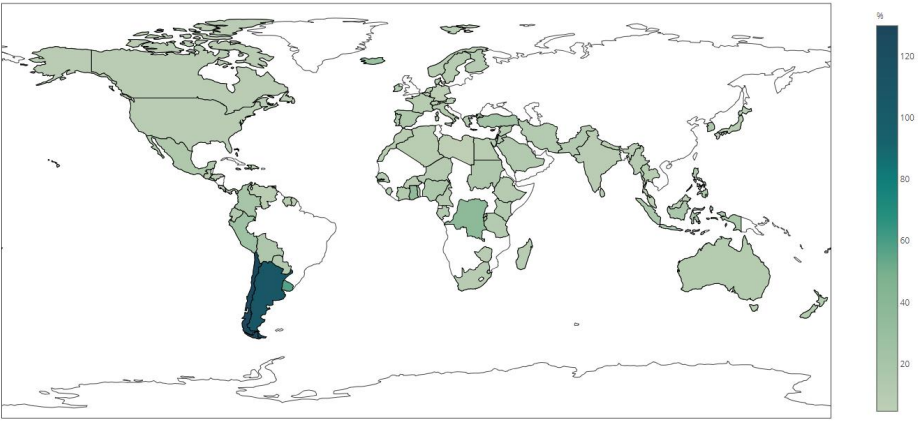 . Source: Inflation by the Decades: 1970s, by: Steve H. Hanke and Tal Boger
In this post, I look at some data from FRED related to inflation. Here is a list I compile,, and will expand in the future. Note that the sources of original data came from government agencies, and organizations such as the IMF.
| MEV | frequency | date |
|---|---|---|
| M2Sl | monthly | first of month |
| BASE | bi-weekly | 2019-12-18 00:00:00 |
| M2V | quarterly | first of quarter |
| DCOILWTICO | daily | nan |
| PALLFNFINDEXQ | quarterly | first of quarter |
| CPIAUCSL | monthly | first of month |
| PPIACO | monthly | first of month |
| USSTHPI | quarterly | first of quarter |
| FEDFUNDS | monthly | first of month |
| DGS10 | daily | nan |
| TB3MS | monthly | first of month |
| UNRATE | monthly | first of month |
| GDP | quarterly | first of quarter |
| GDPC1 | quarterly | first of quarter |
| STLFSI | weekly | nan |
| VIXCLS | daily | nan |
This post presents the data that shows too much money has inflicted inflation. The recent trends indicates that it is likely going to stay and get worse in time.
Money Suppy
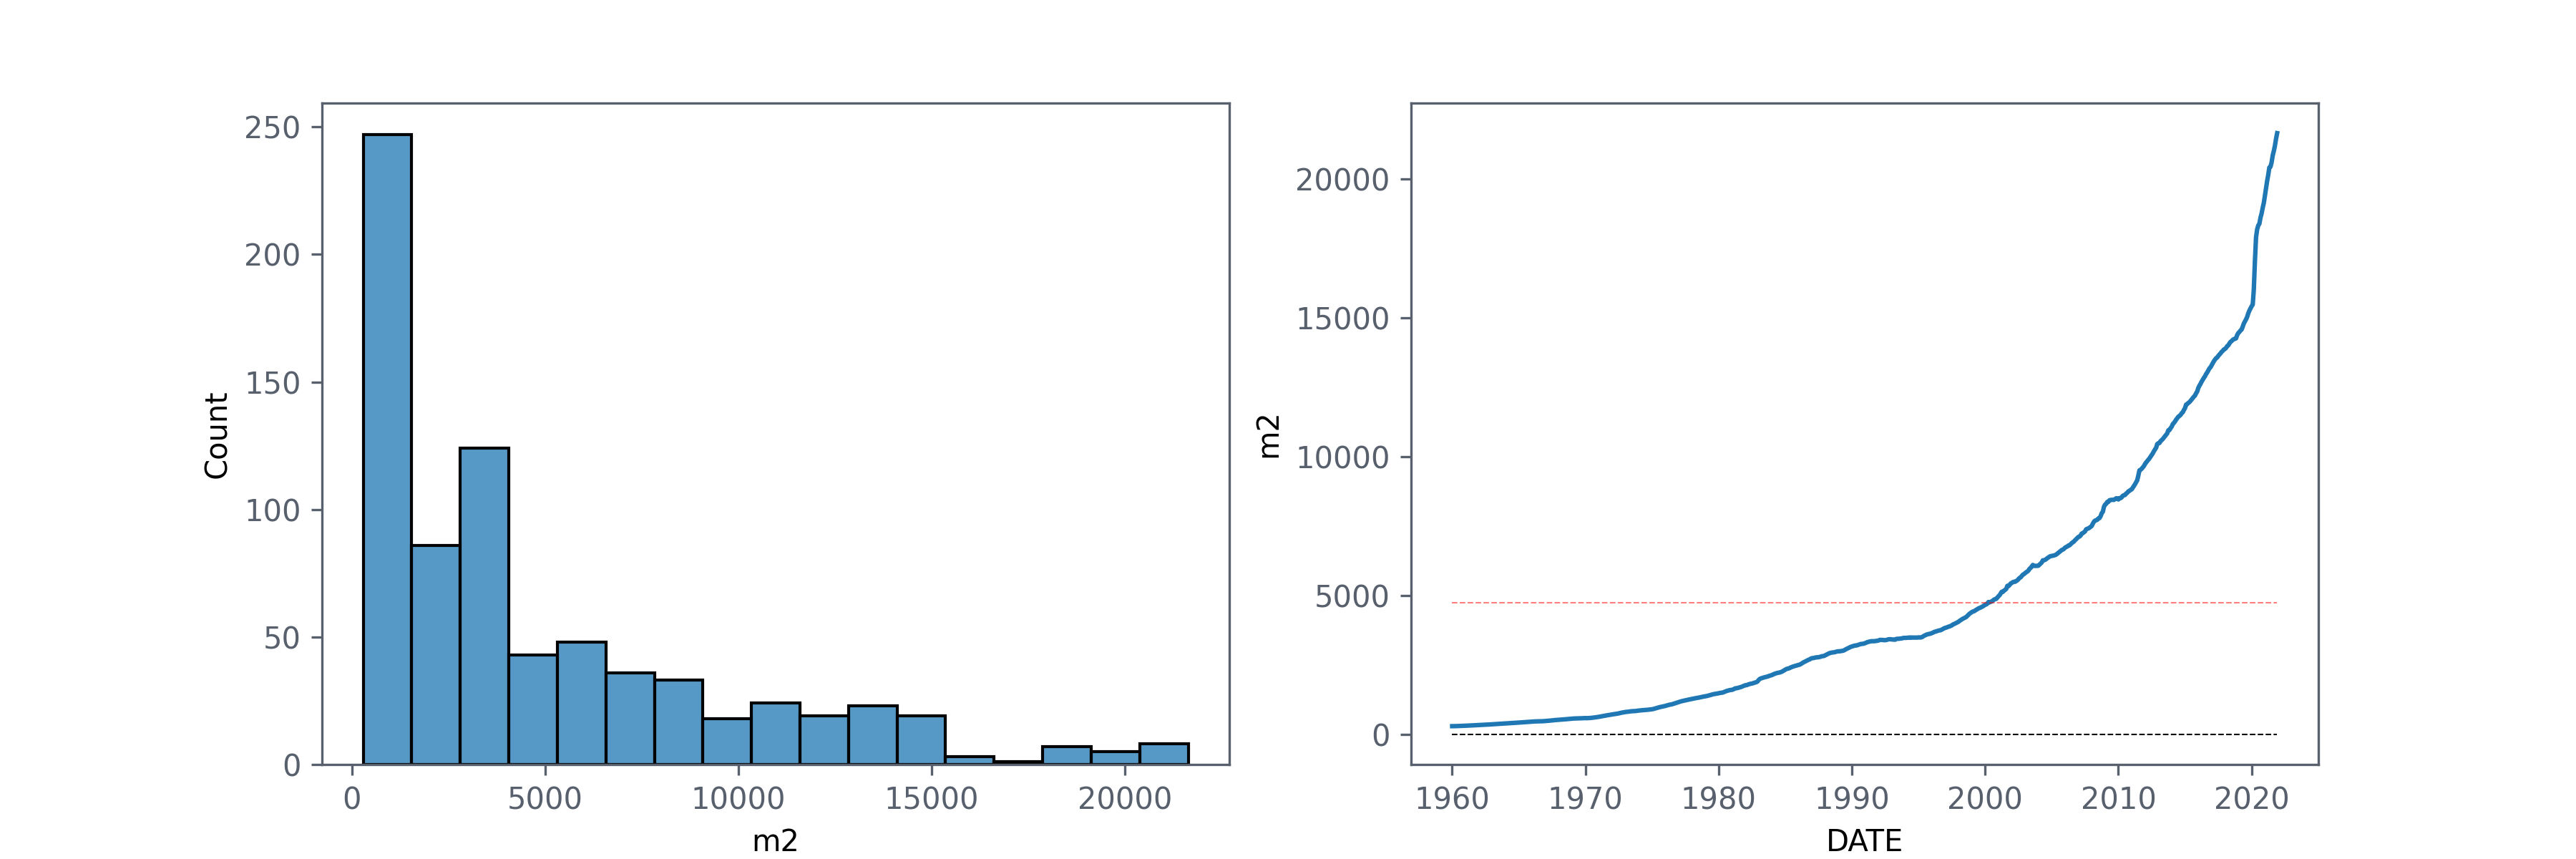
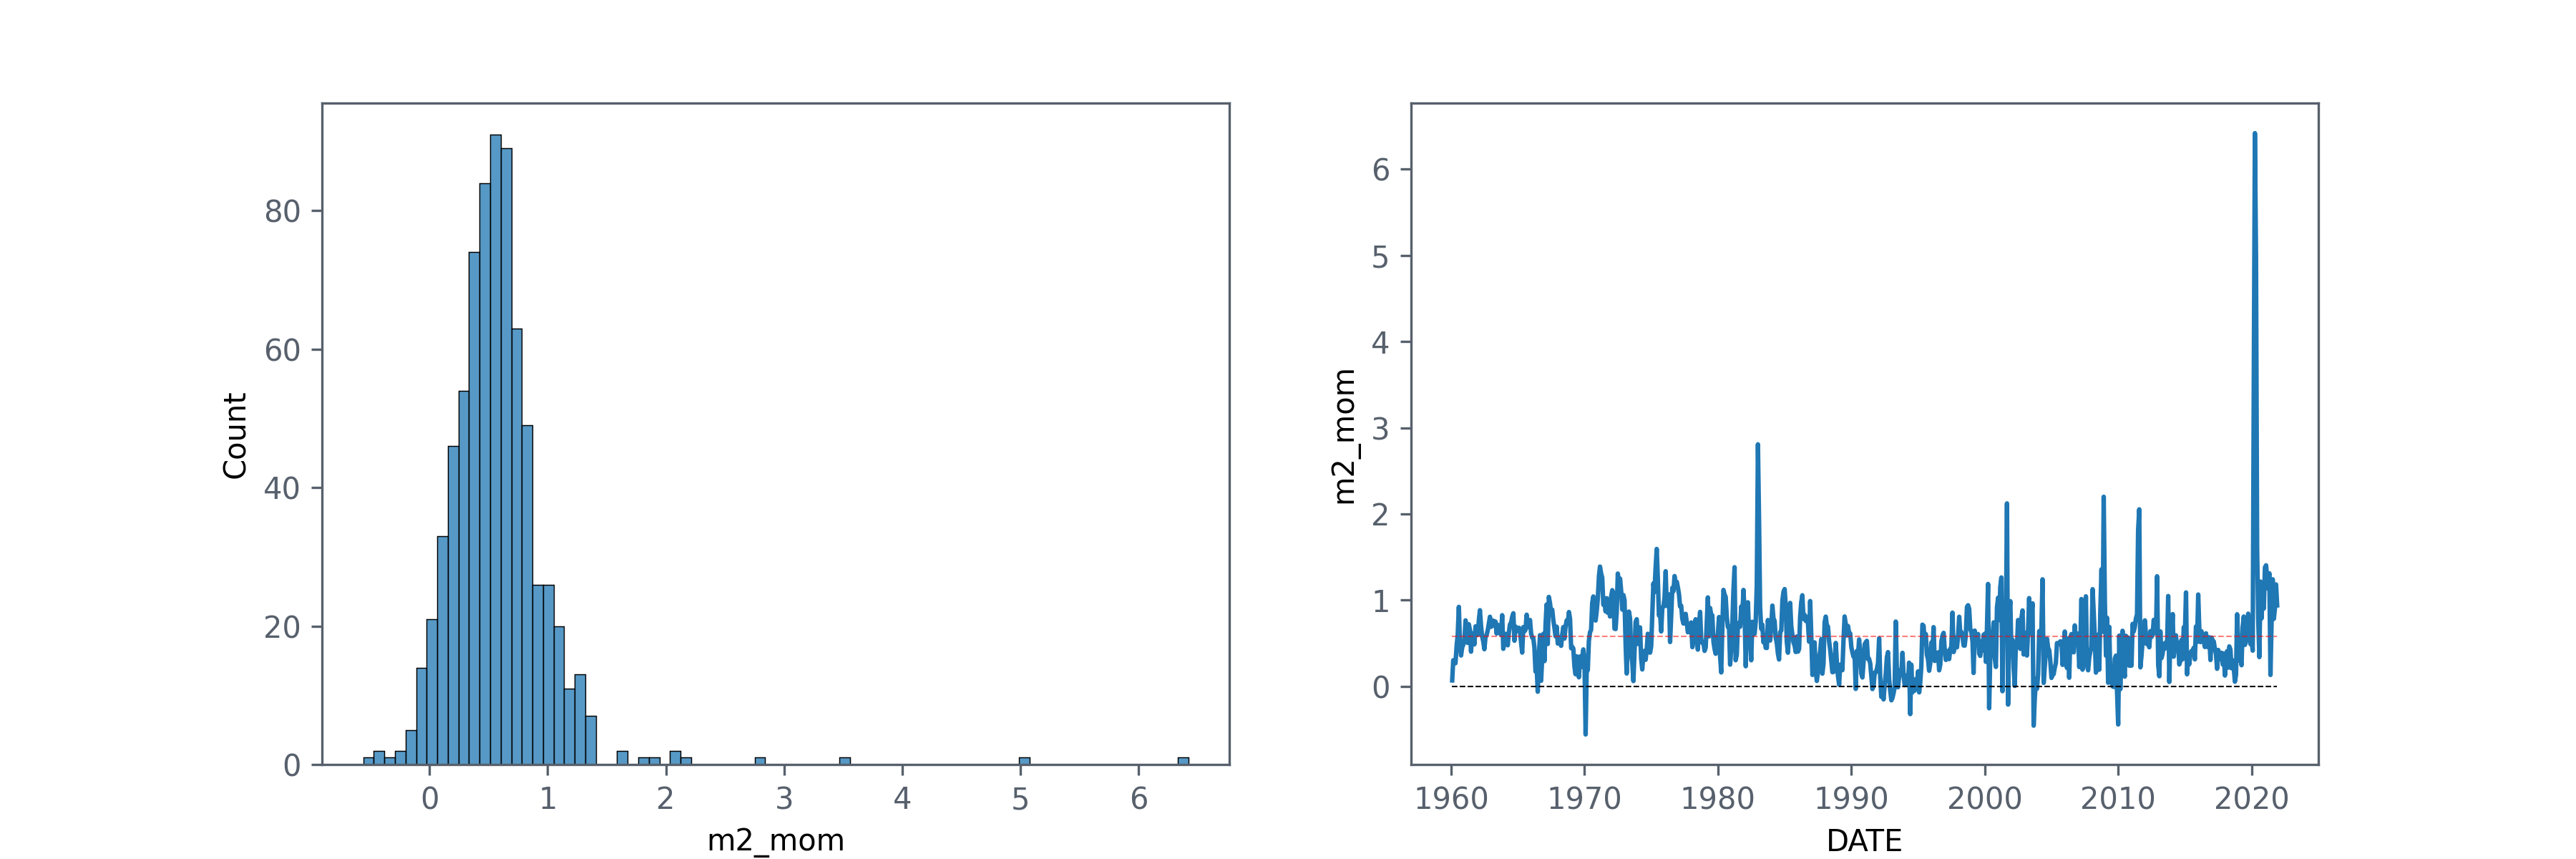
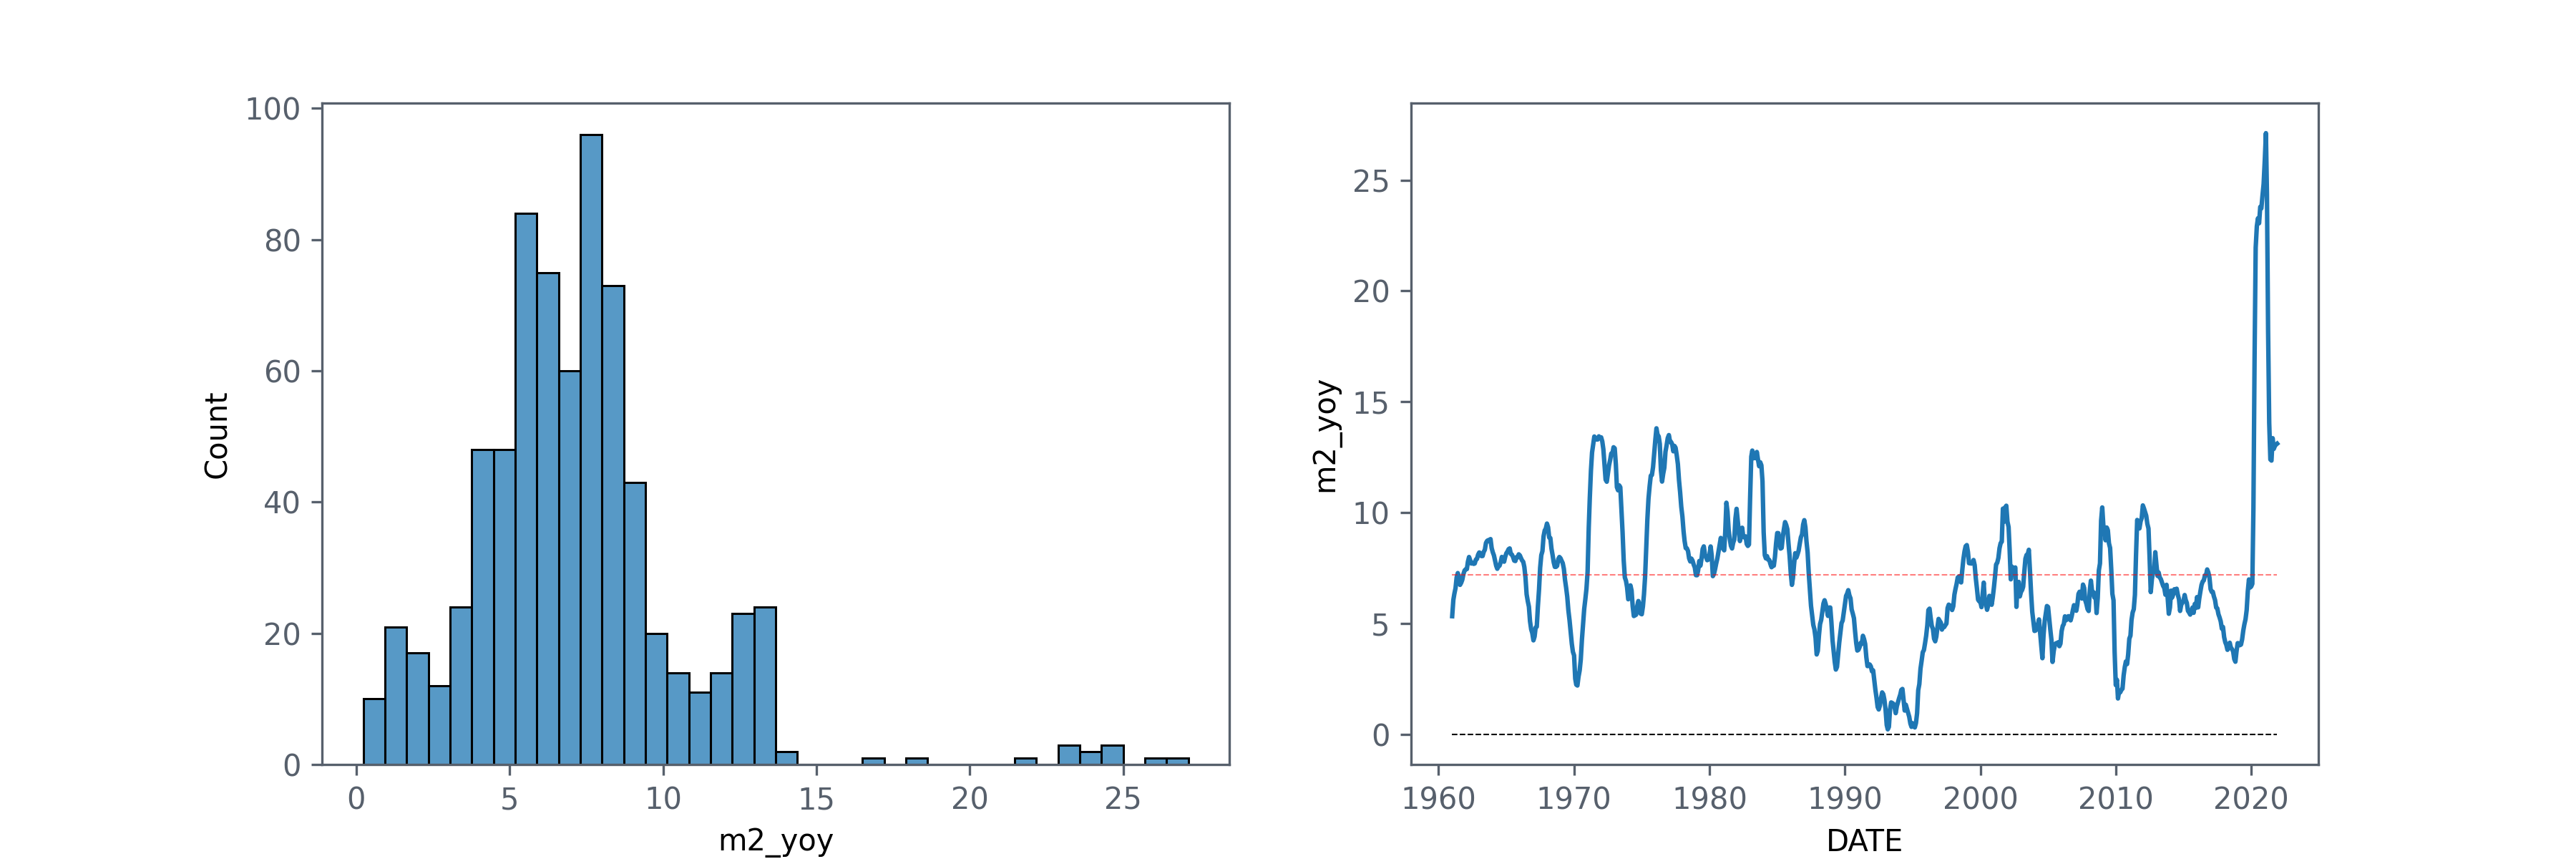
M2
MEV = 'M2Sl'^M
NAME = "m2"^M
m2 = get_series(MEV, NAME)
# The max happens on  m2   2021-12-01
# dtype: datetime64[ns]
#                   m2
# DATE
# 2021-12-01 21638.100
# The min happens on  m2   1960-01-01
# dtype: datetime64[ns]
#                 m2
# DATE
# 1960-01-01 298.200
Money velocity
DATE
1960-01-01 1.817
1960-04-01 1.797
1960-07-01 1.780
1960-10-01 1.737
1961-01-01 1.723

DATE
2020-10-01 1.134
2021-01-01 1.121
2021-04-01 1.119
2021-07-01 1.115
2021-10-01 1.120

The max happens on  m2v   1997-07-01

DATE
1997-07-01 2.192

The min happens on  m2v   2020-04-01
DATE
2020-04-01 1.100
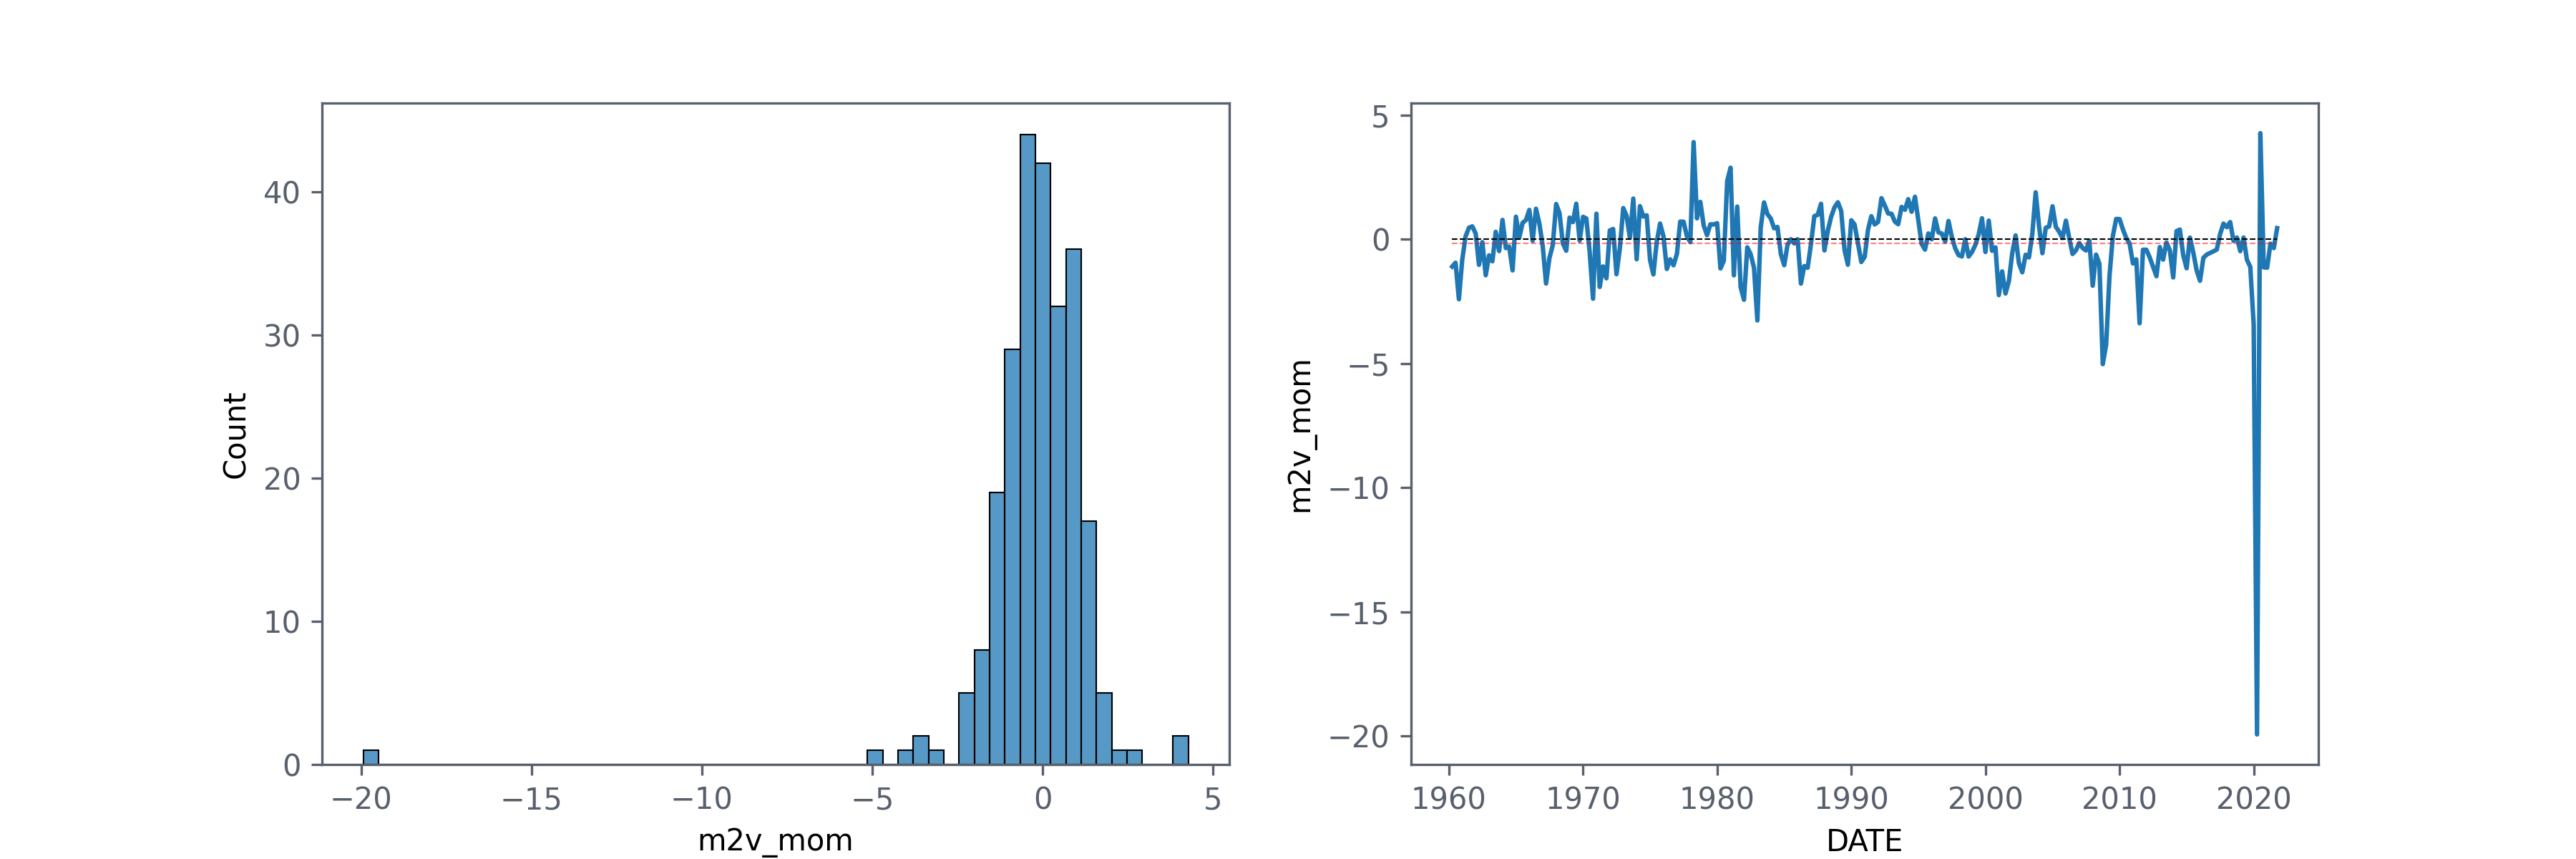
             m2v_mom
 DATE
 1960-04-01   -1.101
 1960-07-01   -0.946
 1960-10-01   -2.416
 1961-01-01   -0.806
 1961-04-01    0.116
             m2v_mom
 DATE
 2020-10-01   -1.133
 2021-01-01   -1.146
 2021-04-01   -0.178
 2021-07-01   -0.357
 2021-10-01    0.448
 The max happens on  m2v_mom   2020-07-01
 dtype: datetime64[ns]
             m2v_mom
 DATE
 2020-07-01    4.273
 The min happens on  m2v_mom   2020-04-01
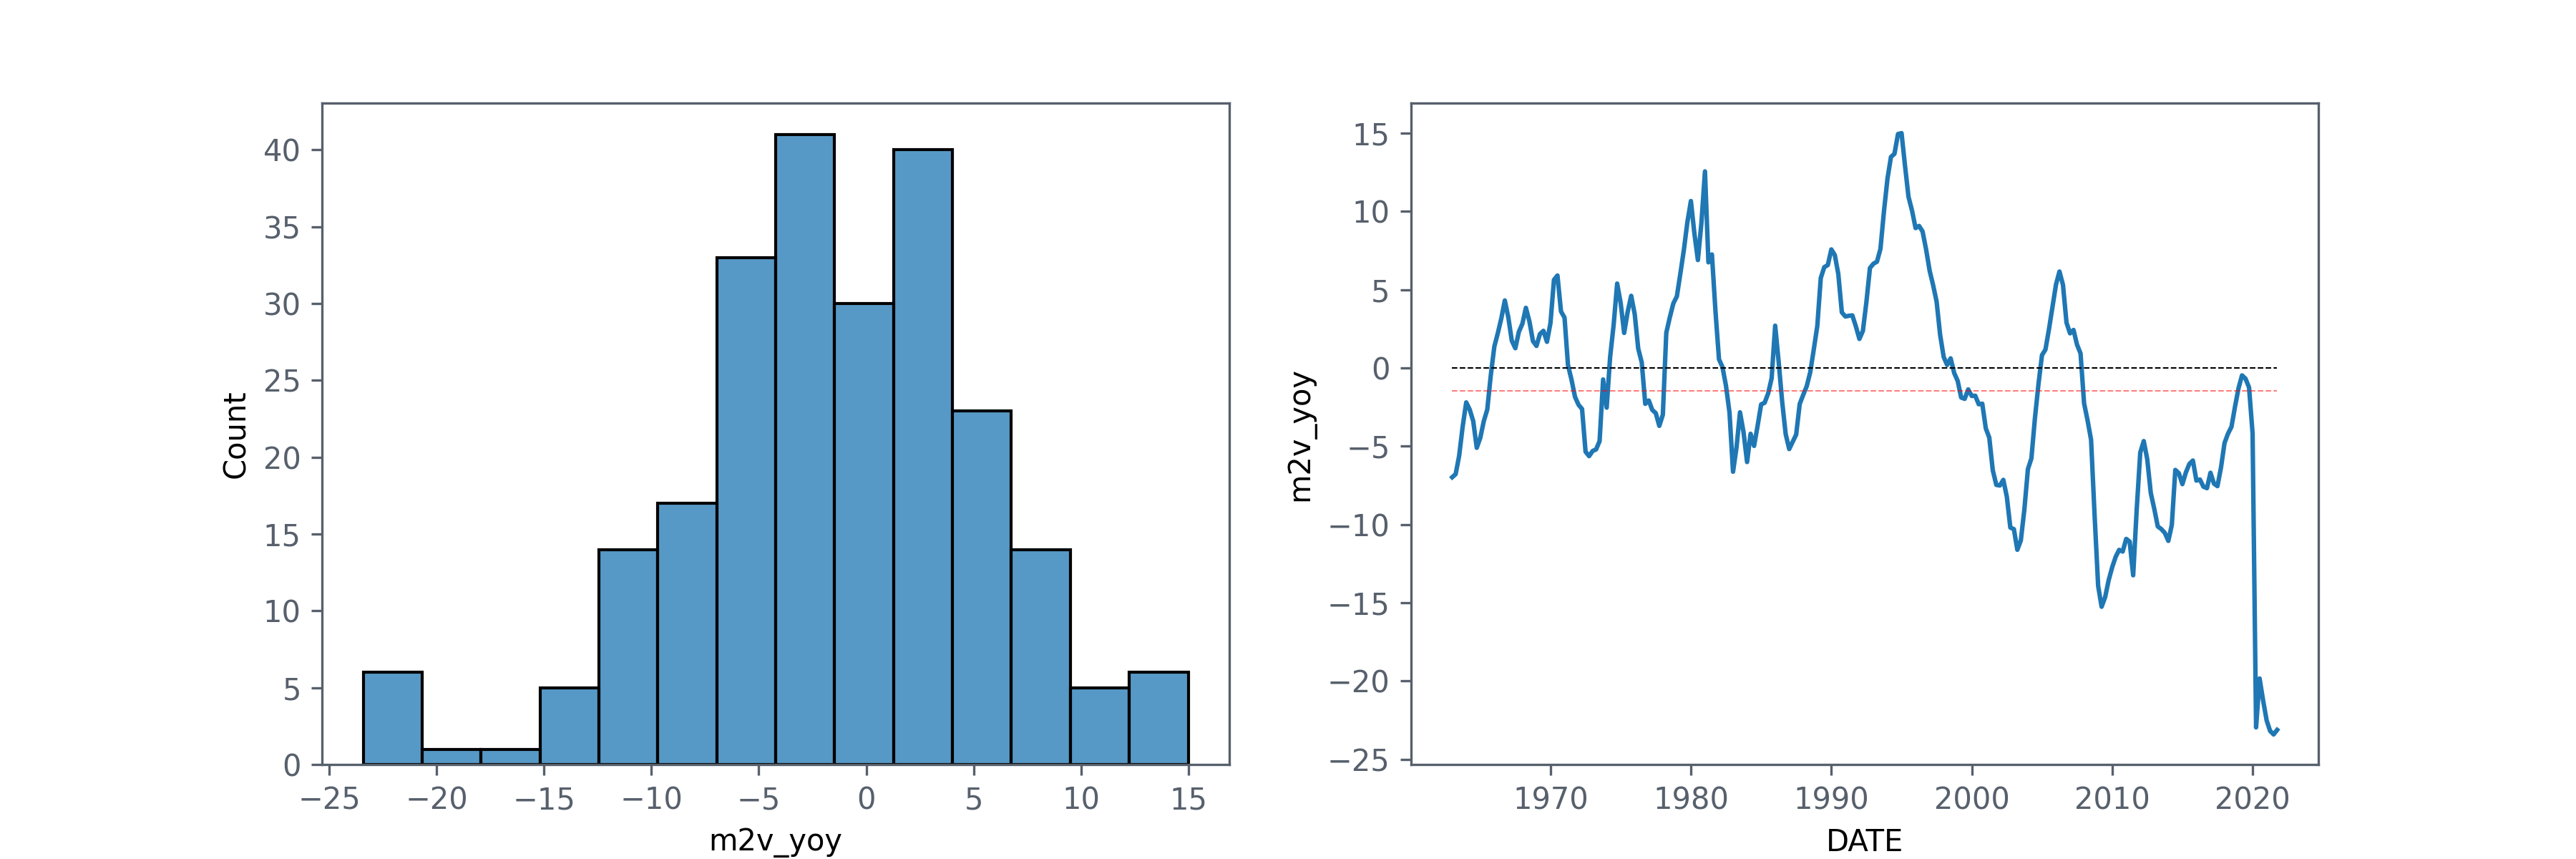
 m2v_yoy = level_to_yoy(m2v, NAME)
 #             m2v_yoy
# DATE
# 1963-01-01   -6.990
# 1963-04-01   -6.789
# 1963-07-01   -5.618
# 1963-10-01   -3.742
# 1964-01-01   -2.205
# The max happens on  m2v_yoy   1995-01-01
# dtype: datetime64[ns]
#             m2v_yoy
# DATE
# 1995-01-01   14.995
# The min happens on  m2v_yoy   2021-07-01
# dtype: datetime64[ns]
Velocity of money year over year change rate
Oil
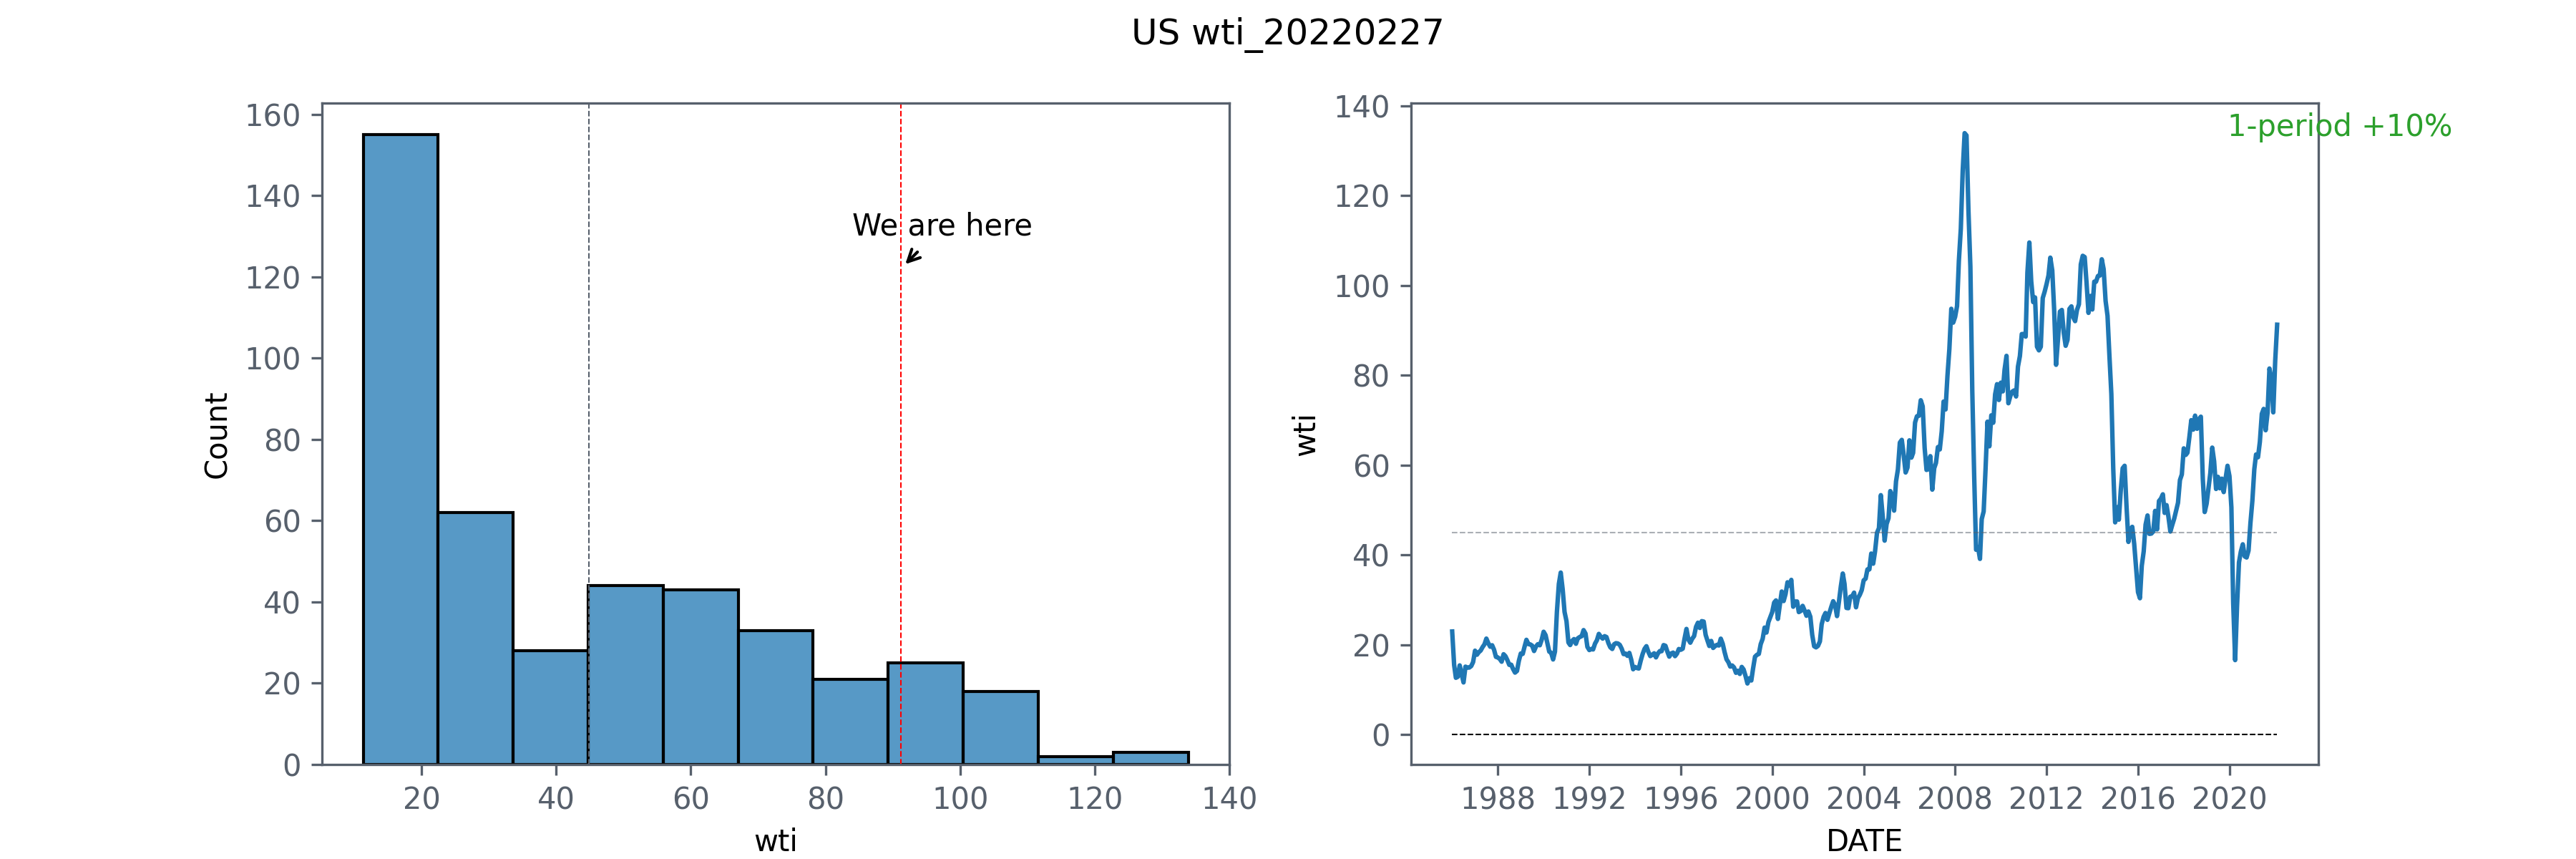
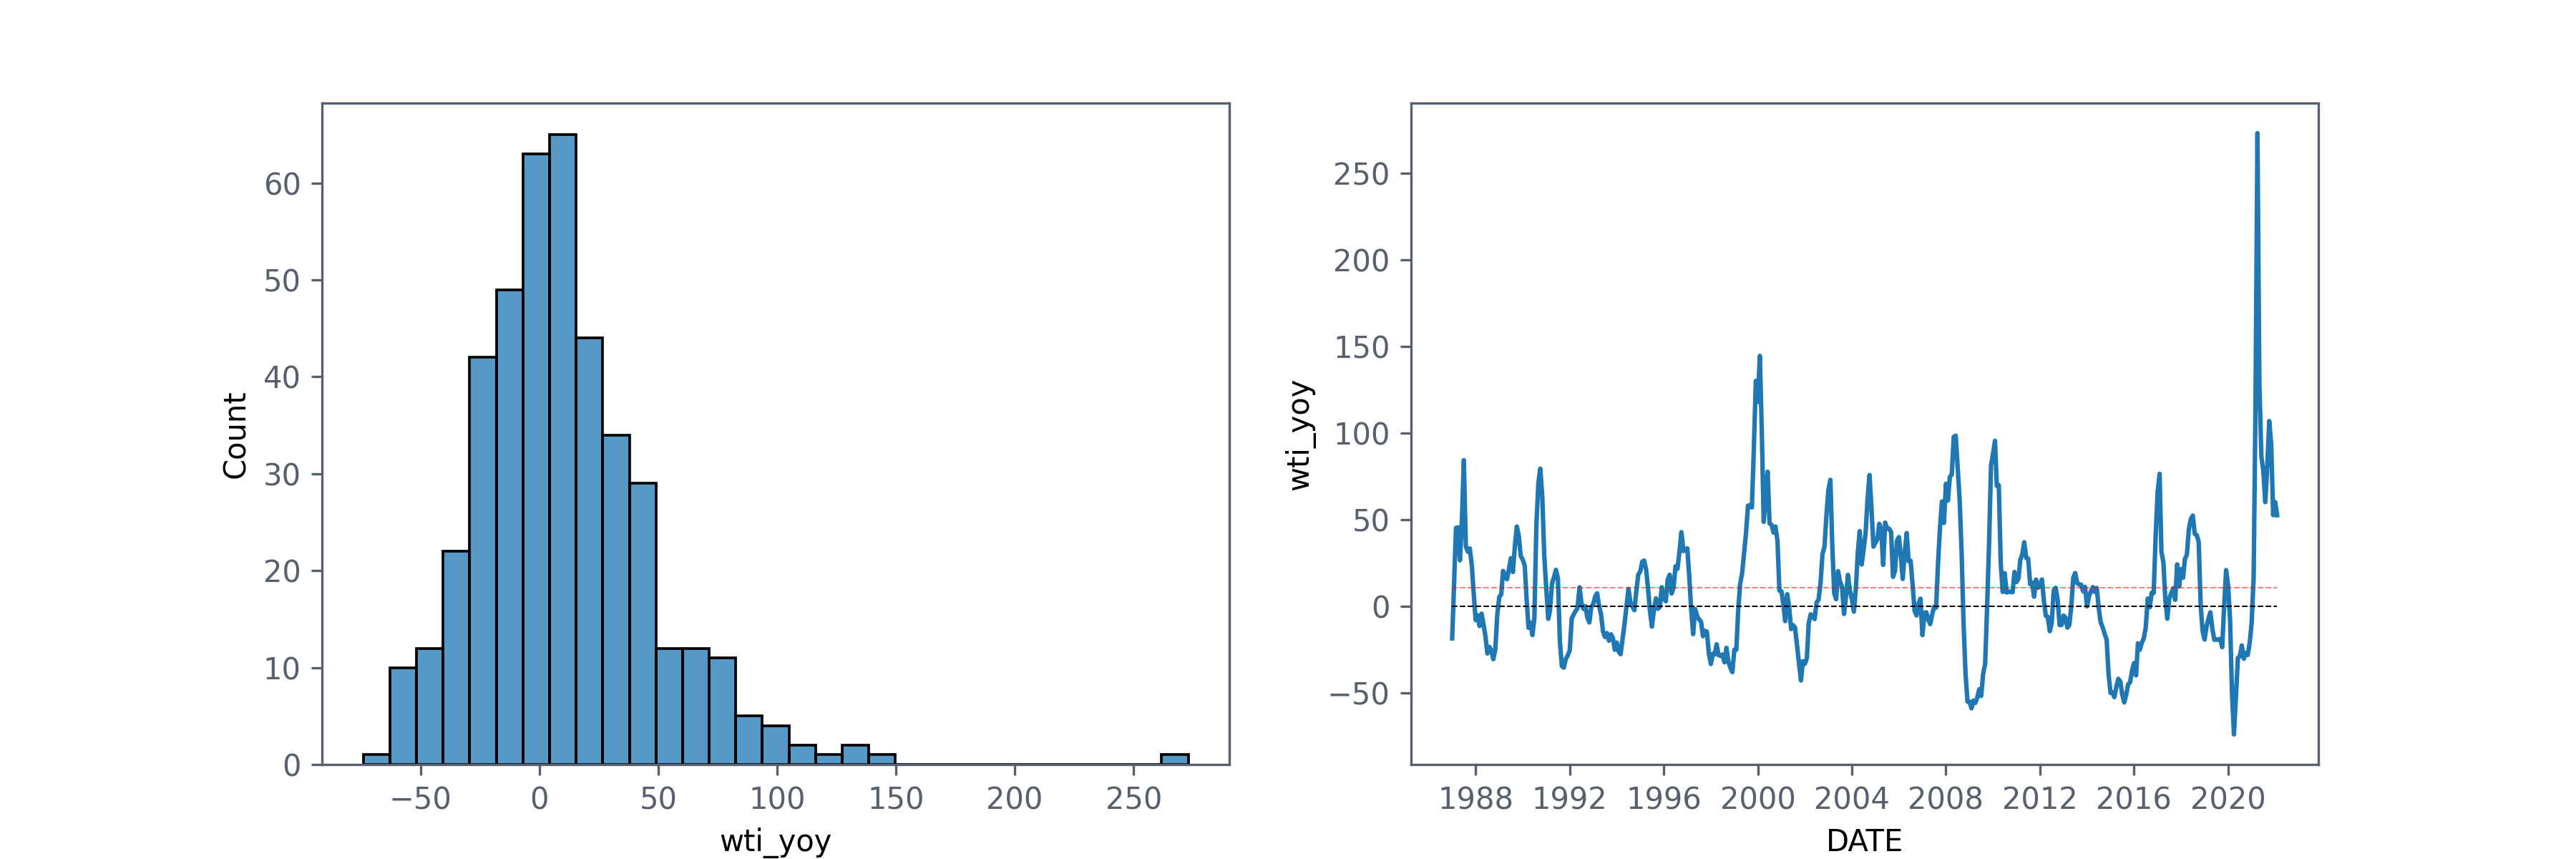
While alternative energy has been increasing, oil is still extremely important to the economy, not only as an energy source.
The most susceptible industries to oil prices are: food production (most fertilizers and pesticides are made of oil, tractors run on oil, and food distribution rely on oil), transportation, airline travels, consumer discretionary, chemicals, and some construction materials.
MEV = 'DCOILWTICO'
NAME = 'wti'
with open(file_mev, 'w') as f:
f.write("\n")
f.write("**************************************")
f.write("WTI oil price")
wti = get_series(MEV, NAME)
plot_series(wti,NAME)
wti = daily_to_monthly(wti, NAME)
wti_yoy = level_to_yoy(wti, NAME)
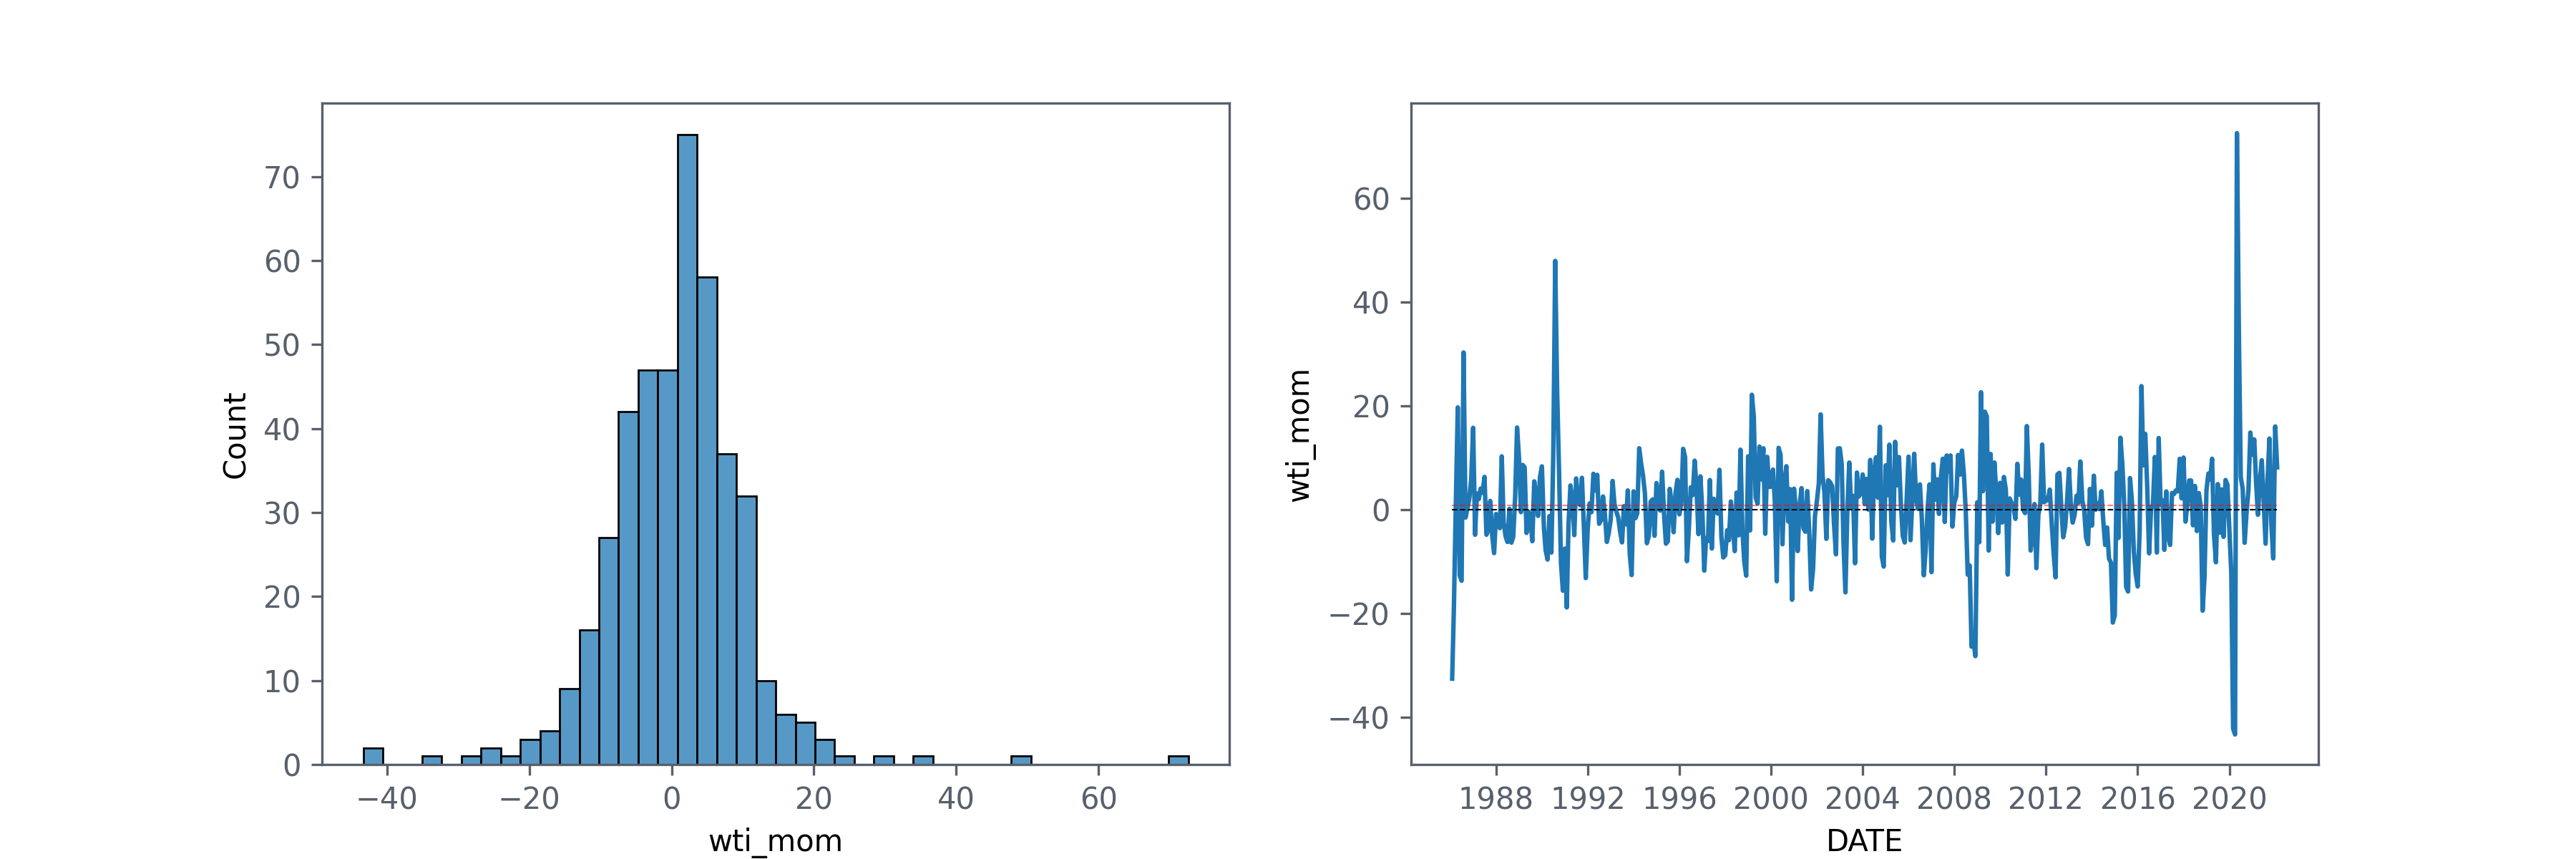
wti_mom = level_to_mom(wti, NAME) # convert to yoy and plot
The latest data is as Febuary, 2022. The monthly average price is $91.2.
wti Month over Month
wti Year over Year
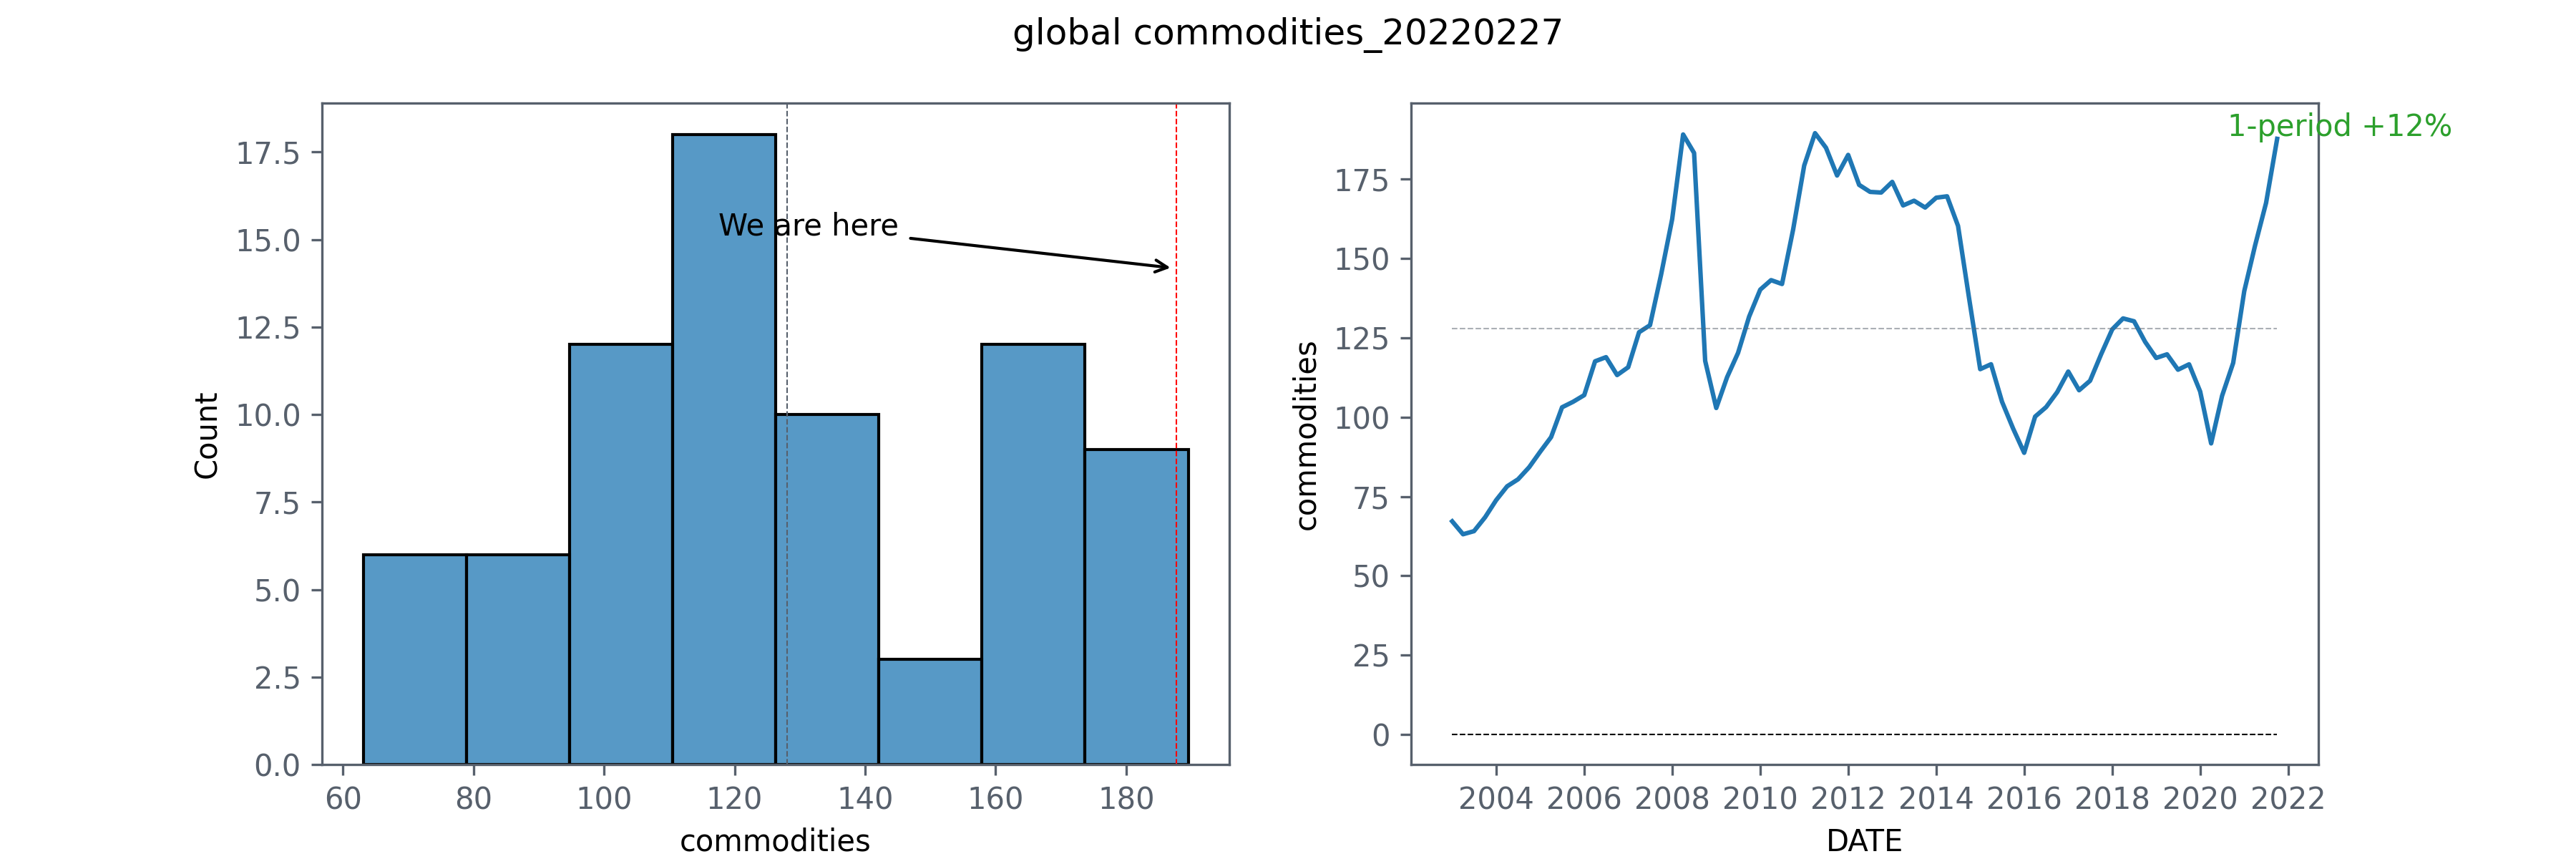
Global commodities
MEV = ‘PALLFNFINDEXQ’, or ‘PALLFNFINDEXM’ NAME = ‘commodities’ Latest data from Fred is as of 3Q2021. I used the quarterly data, but for the month over month plot, I used monthly data.
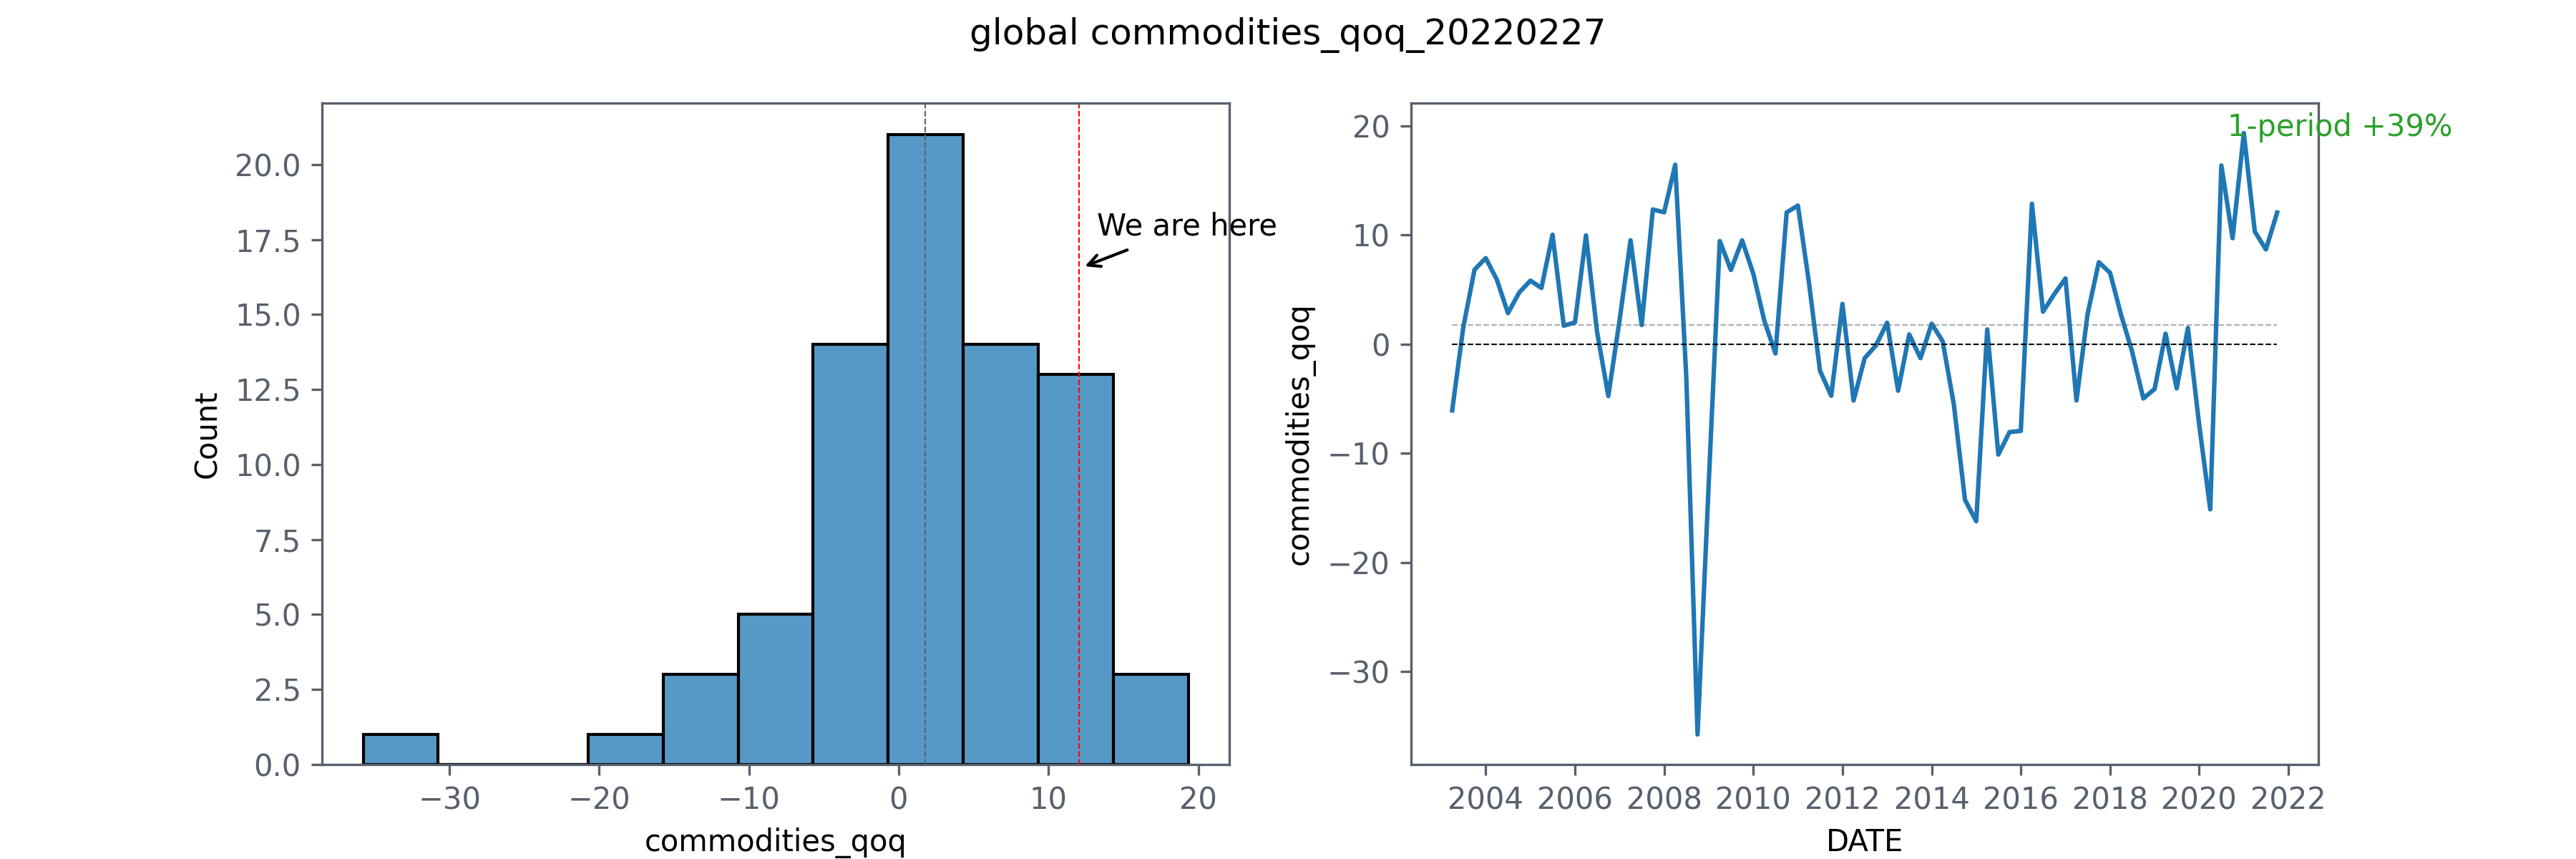
Global Commodities Quarter over Quarter
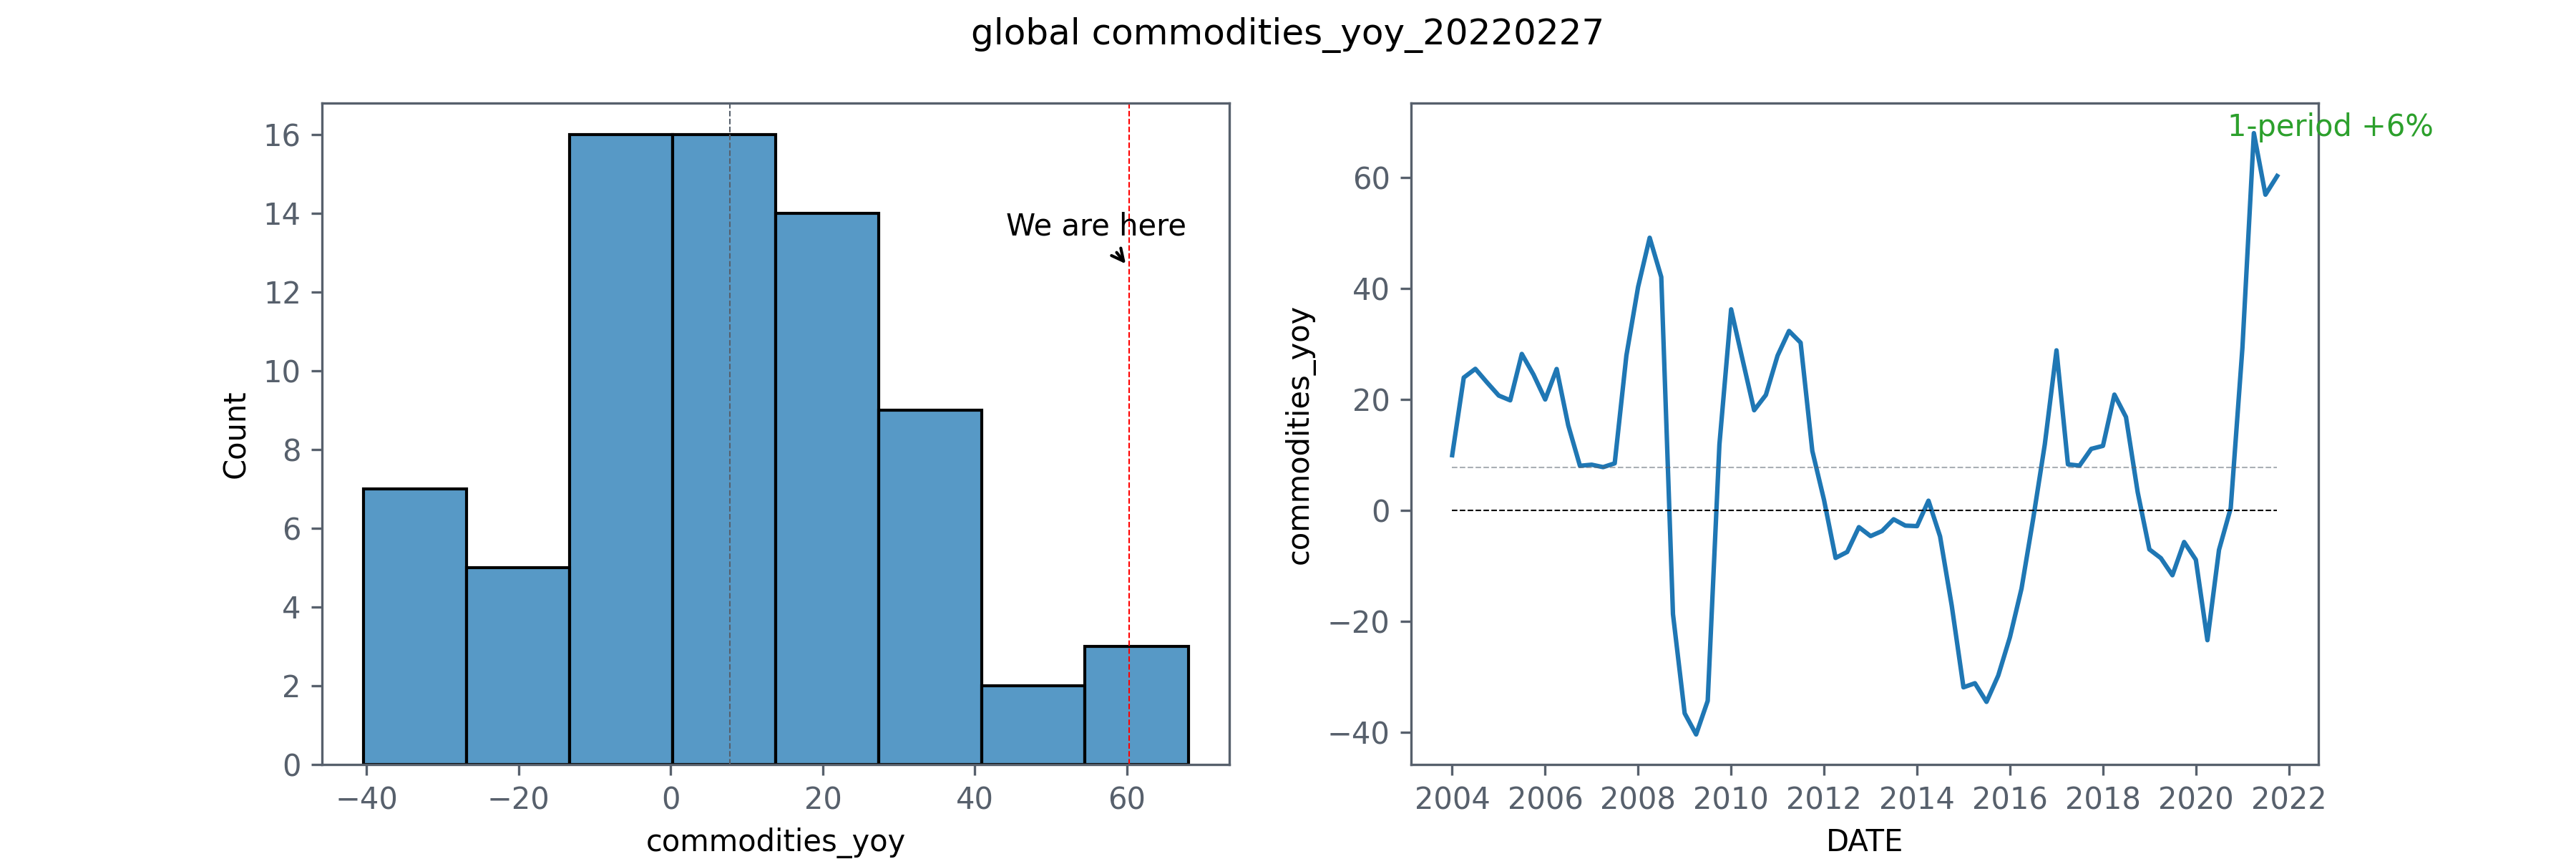
Global Commodities Year over Year
Global Commodities Month over Month
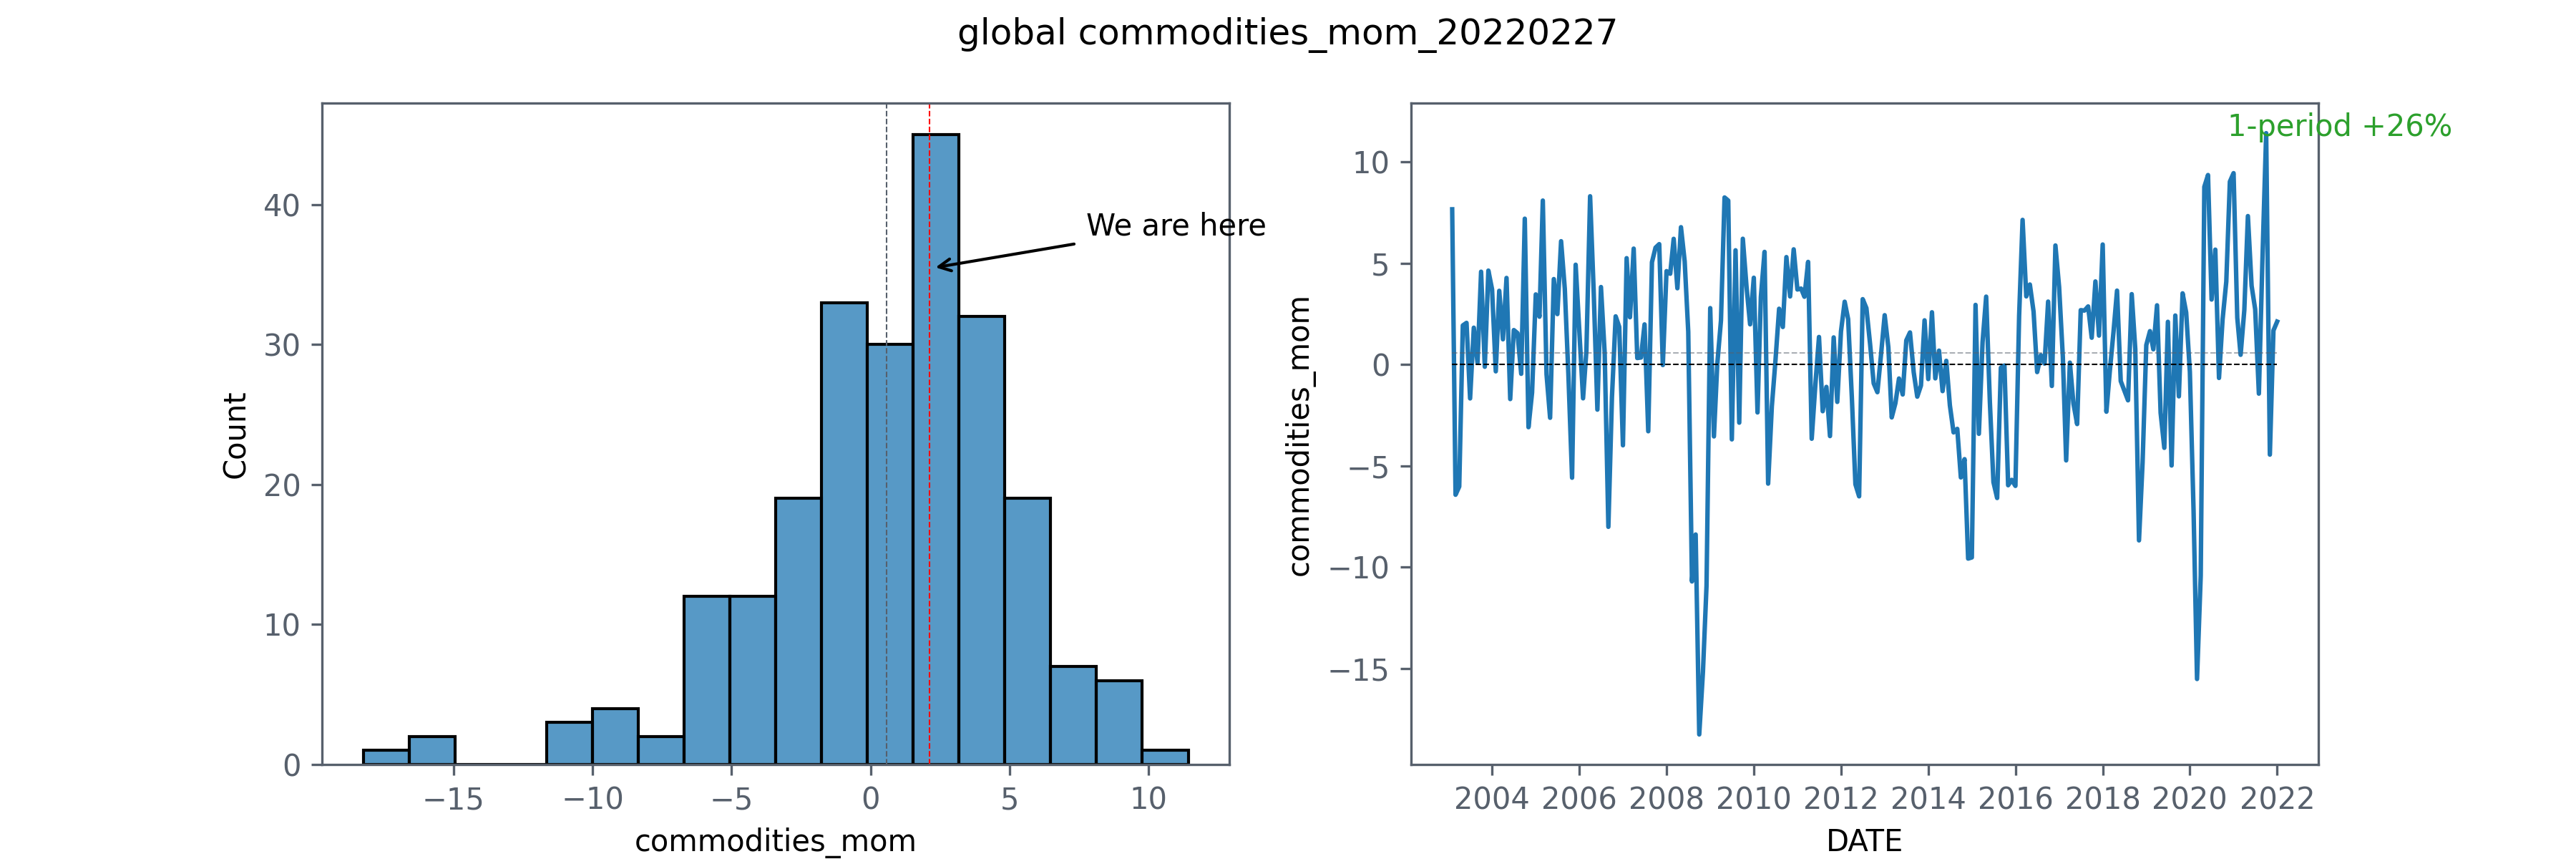
The commodity index is highest in 2Q2011.
The highest spikes were in 1Q2021, in the midst of the pandemic. And the other extreme took place in 3Q2008 during the GFC.
| DATE | commodities | Max_min | DATE | commodities_qoq | Max_min | DATE | commodities_yoy | Max_min | DATE commodities_mom | Max_min |
|---|---|---|---|---|---|---|---|---|---|---|
| 2011-04-01 | 189.5 | Max | 2021-01-01 | 19.3 | Max | 2021-04-01 | 68 | Max | 2021-10-01 11.4 | Max |
| 2003-04-01 | 63.1 | min | 2008-10-01 | -35.8 | min | 2009-04-01 | -40.4 | min | 2008-10-01 -18.2 | min |
Quaterly data:
| DATE | commodities | commodities_qoq | commodities_yoy |
|---|---|---|---|
| 2018-10-01 | 123.7 | -5 | 3.3 |
| 2019-01-01 | 118.7 | -4.1 | -7.1 |
| 2019-04-01 | 119.8 | 1 | -8.6 |
| 2019-07-01 | 115 | -4 | -11.7 |
| 2019-10-01 | 116.7 | 1.5 | -5.7 |
| 2020-01-01 | 108.1 | -7.4 | -8.9 |
| 2020-04-01 | 91.7 | -15.1 | -23.4 |
| 2020-07-01 | 106.7 | 16.4 | -7.1 |
| 2020-10-01 | 117.1 | 9.7 | 0.4 |
| 2021-01-01 | 139.7 | 19.3 | 29.3 |
| 2021-04-01 | 154.1 | 10.3 | 68 |
| 2021-07-01 | 167.5 | 8.7 | 56.9 |
| 2021-10-01 | 187.7 | 12.1 | 60.3 |
Monthly data
| DATE | commodities | commodities_mom |
|---|---|---|
| 2021-01-01 00:00:00 | 137.4 | 9.4 |
| 2021-02-01 00:00:00 | 140.6 | 2.3 |
| 2021-03-01 00:00:00 | 141.2 | 0.5 |
| 2021-04-01 00:00:00 | 145 | 2.7 |
| 2021-05-01 00:00:00 | 155.7 | 7.3 |
| 2021-06-01 00:00:00 | 161.7 | 3.9 |
| 2021-07-01 00:00:00 | 166.1 | 2.7 |
| 2021-08-01 00:00:00 | 163.8 | -1.4 |
| 2021-09-01 00:00:00 | 172.7 | 5.4 |
| 2021-10-01 00:00:00 | 192.4 | 11.4 |
| 2021-11-01 00:00:00 | 183.8 | -4.4 |
| 2021-12-01 00:00:00 | 186.9 | 1.7 |
| 2022-01-01 00:00:00 | 190.9 | 2.1 |
2. price
The CPI is the most important price gauge in the US, although PPI, HPI and labor costs are important as well.
The CPI data is monthly, HPI quarterly, and PPI data is monthly.
CPI
Prices have been increasing throughout time. Moderate inflation such as 2% annual rate has been considered as good for the economy as it encourages people to spend money (things are cheapter now than in the future) as opposed to saving and hoarding money, which happens if prices don’t increase or even decrease.
The latest CPI data as of writing is January 2022. Figure shows that over the preceeding month, the CPI increased by 1%. This is very significant. Because if we annualize it, it will be 12%, much higher than the 2% target.
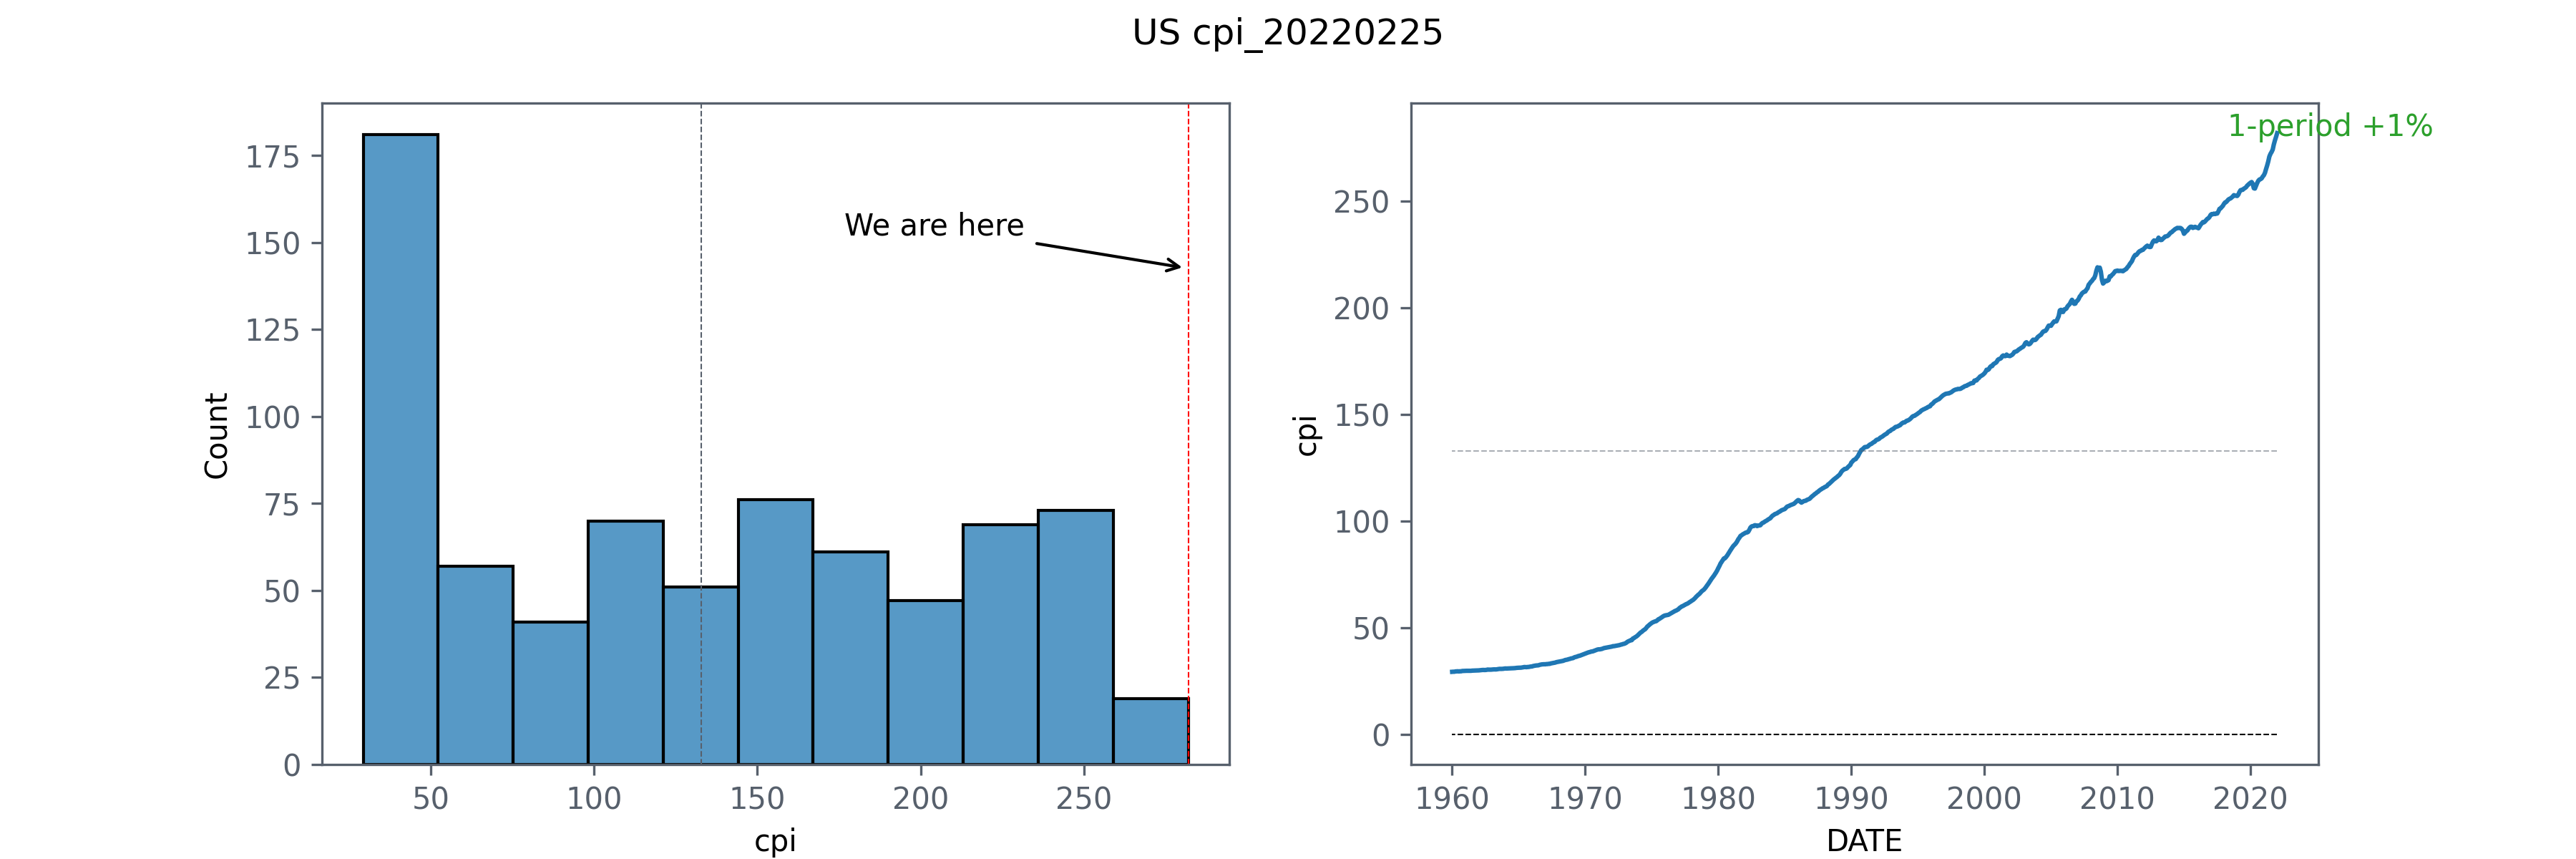
               cpi
DATE
2021-09-01 274.214
2021-10-01 276.590
2021-11-01 278.524
2021-12-01 280.126
2022-01-01 281.933
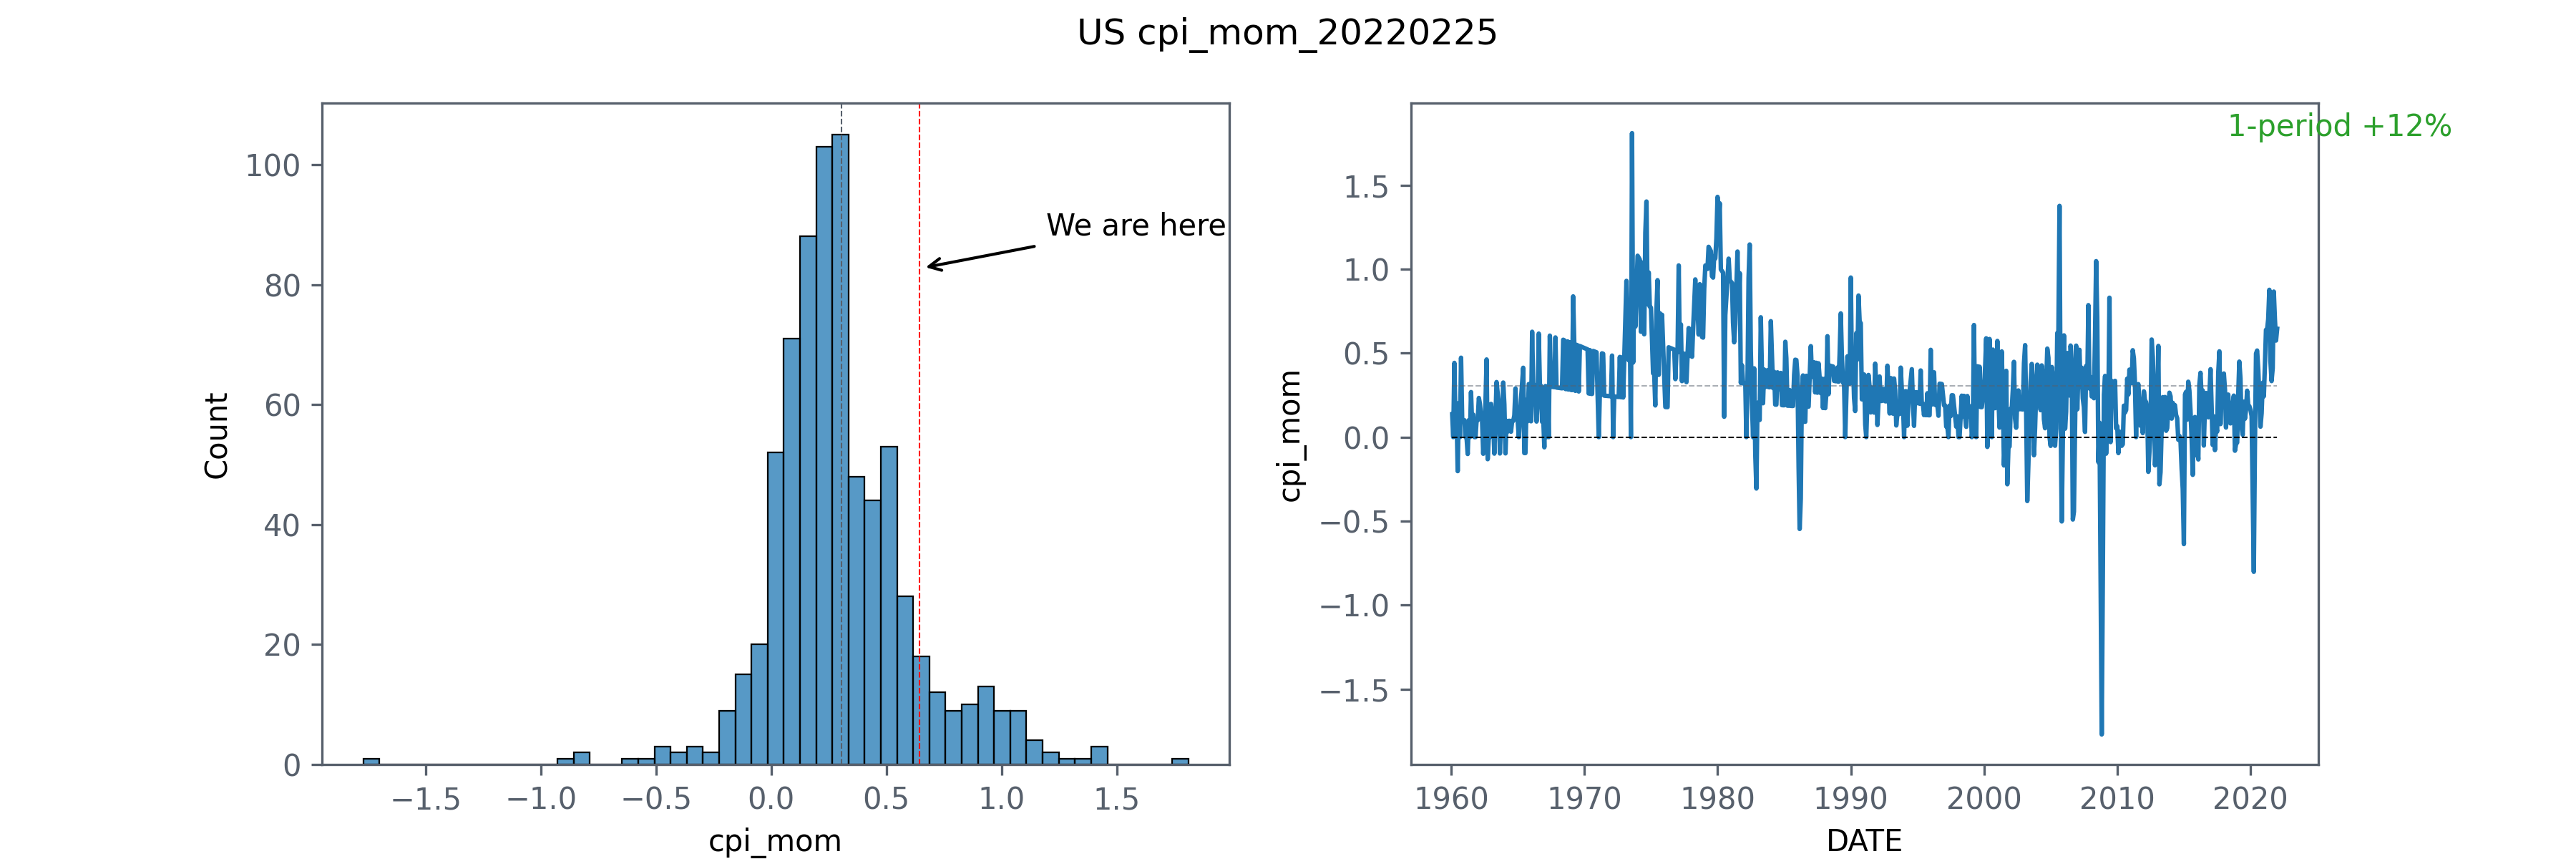
CPI Month over Month
The max month over month growth rate happened in 1973-08. The rate was 1.8%, which is annualized at 21.6%! We know that 1973 was the year of the oil embargo from OPEC to the US. It was an “energy Pearl Harbor” per Nixon adviser.
The min happend in 2008-11, which was -1.77%, right after the collape of Lehman Brothers on September 15, 2008.
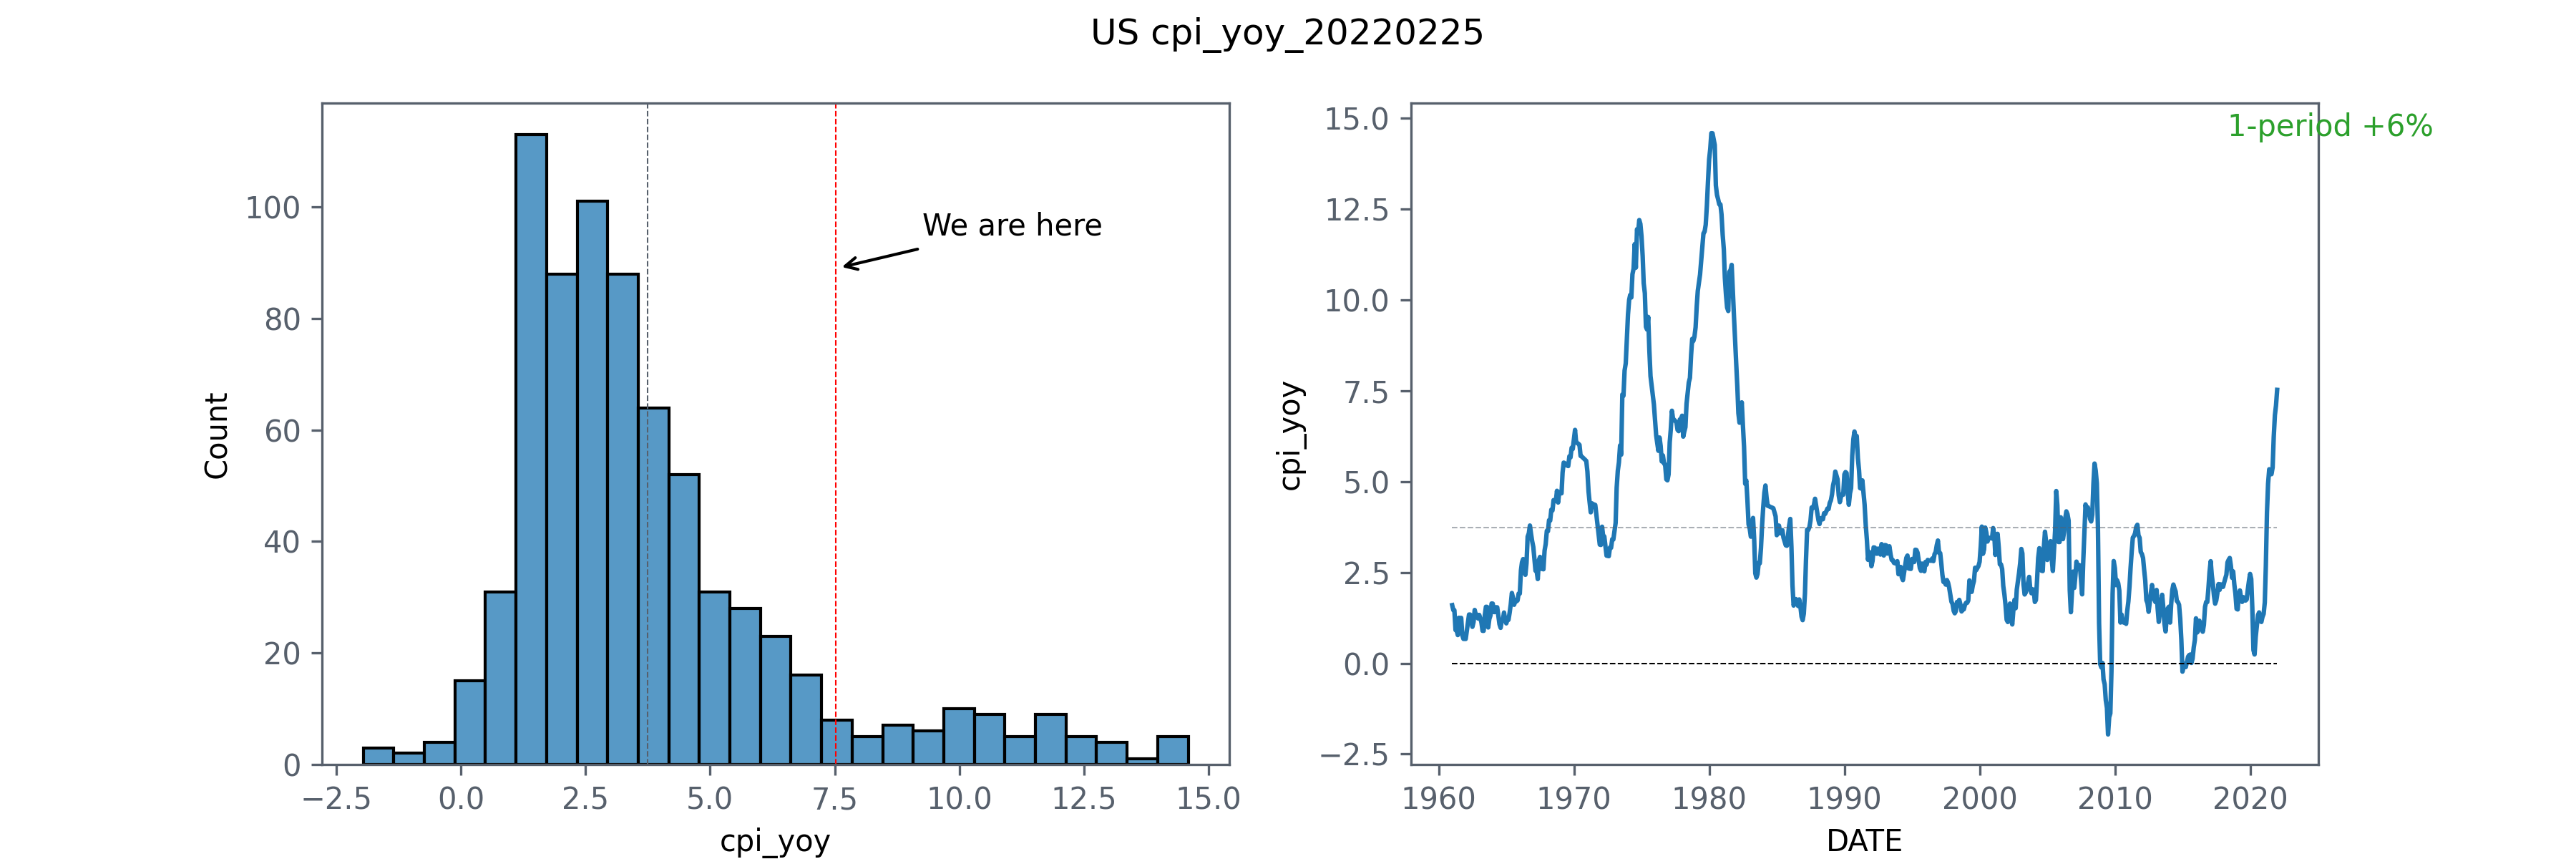
CPI Year over Year
The YoY shown in chart has monthly resolution. For example, January 2022 CPI YoY growth rate compares January, 2022 with January of 2021.
“1-period +6%” means that the YoY growth rate has increased by 6% in January, 2022. In other words, inflation has sped up.
| DATE | cpi_yoy |
|---|---|
| 2021-09-01 | 5.389 |
| 2021-10-01 | 6.236 |
| 2021-11-01 | 6.828 |
| 2021-12-01 | 7.096 |
| 2022-01-01 | 7.525 |
Note that the max cpi_mom happened on 1980-Q1, where the CPI jumped by 14.6%. One of the triggers could be the stoppage of Iranian oil productions in the early part of 1979, and the cutback of productions of OPEC, which kept the oil prices high. Aggrevating a situation of shorter supply is hoarding, which increases demand.
The smallest CPI month over month growth rate happened in 3Q2009, right in the GFC.
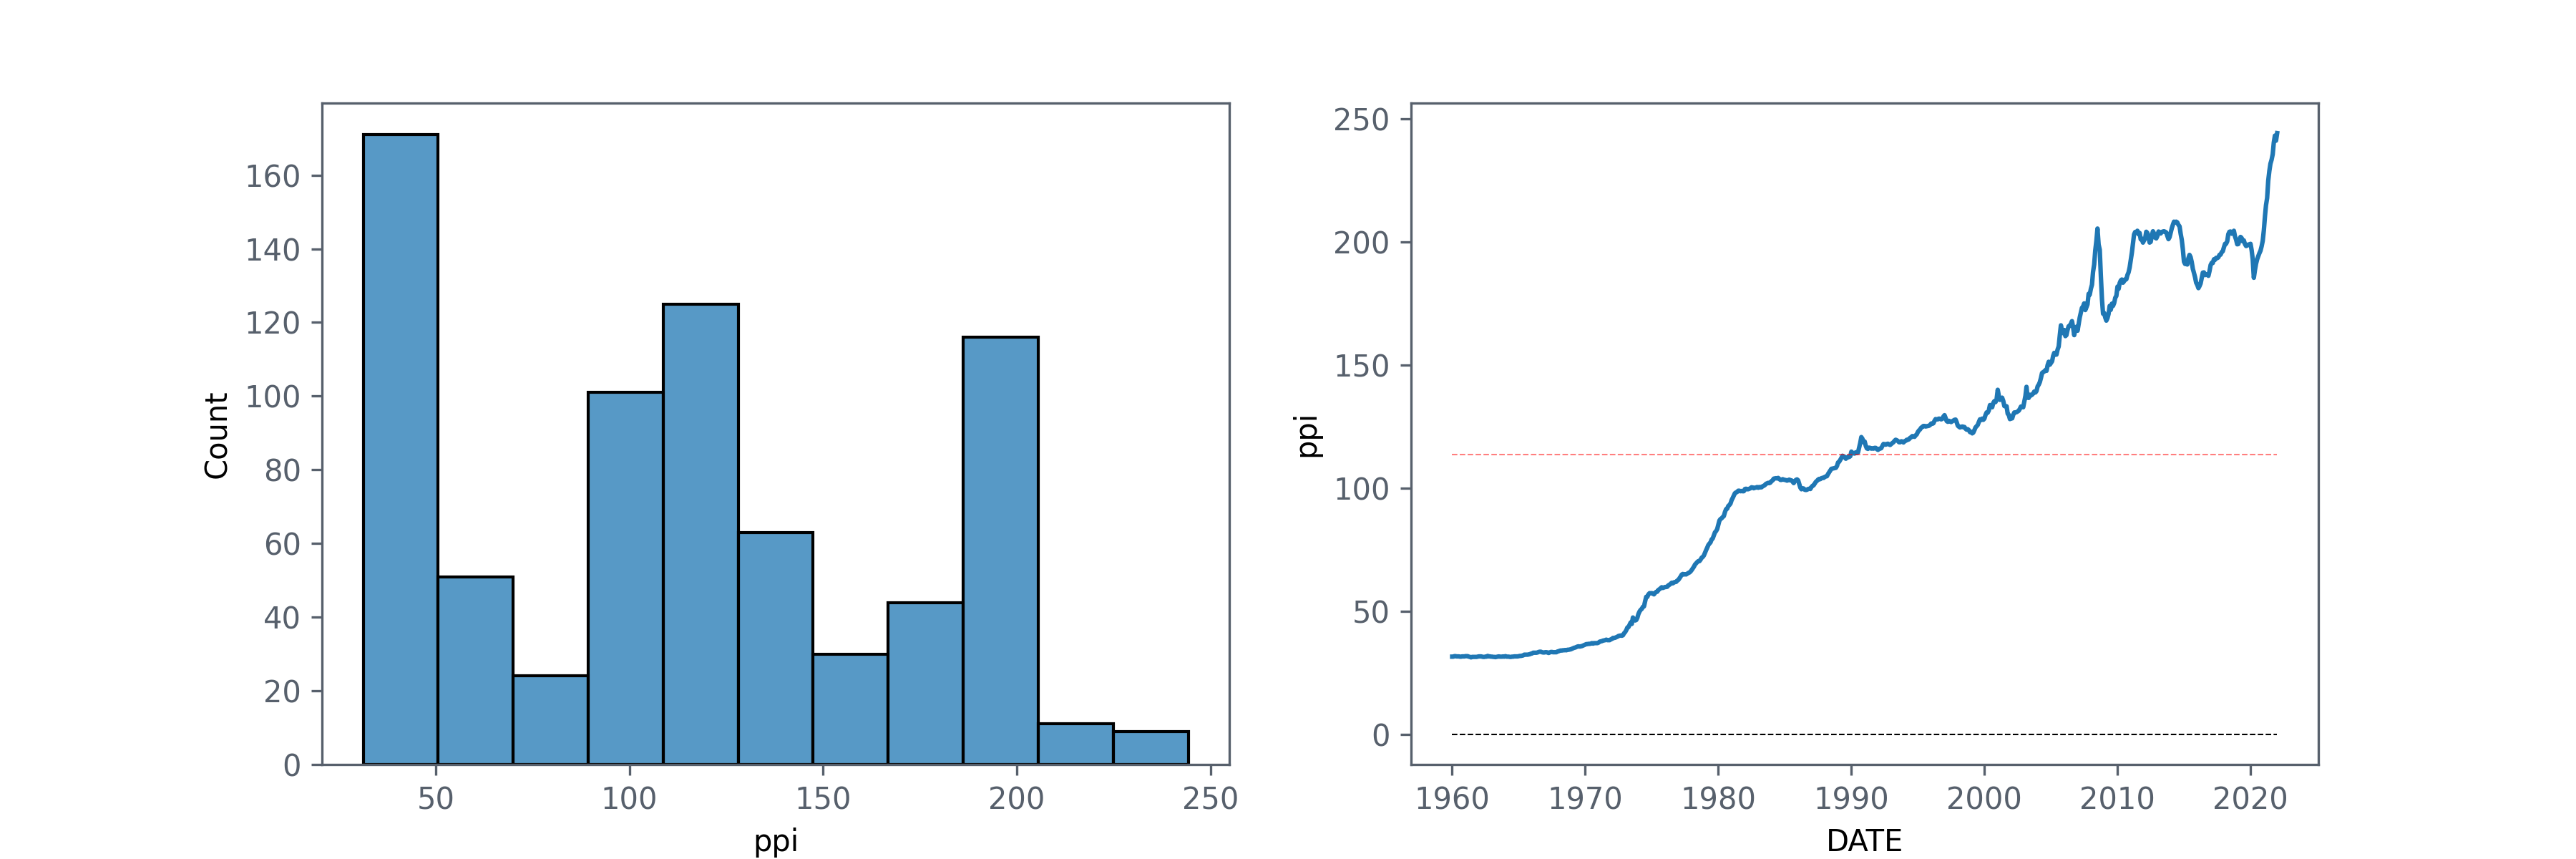
PPI
The producer price index is a measure on how much it costs to produce goods. It is supposed to be a leading factor for CPI.
However, from the plot we can see that the recent rise in PPI is not monotonic, with December number smaller than November.
But the overall recent year PPI YOY is much higher than a year ago.
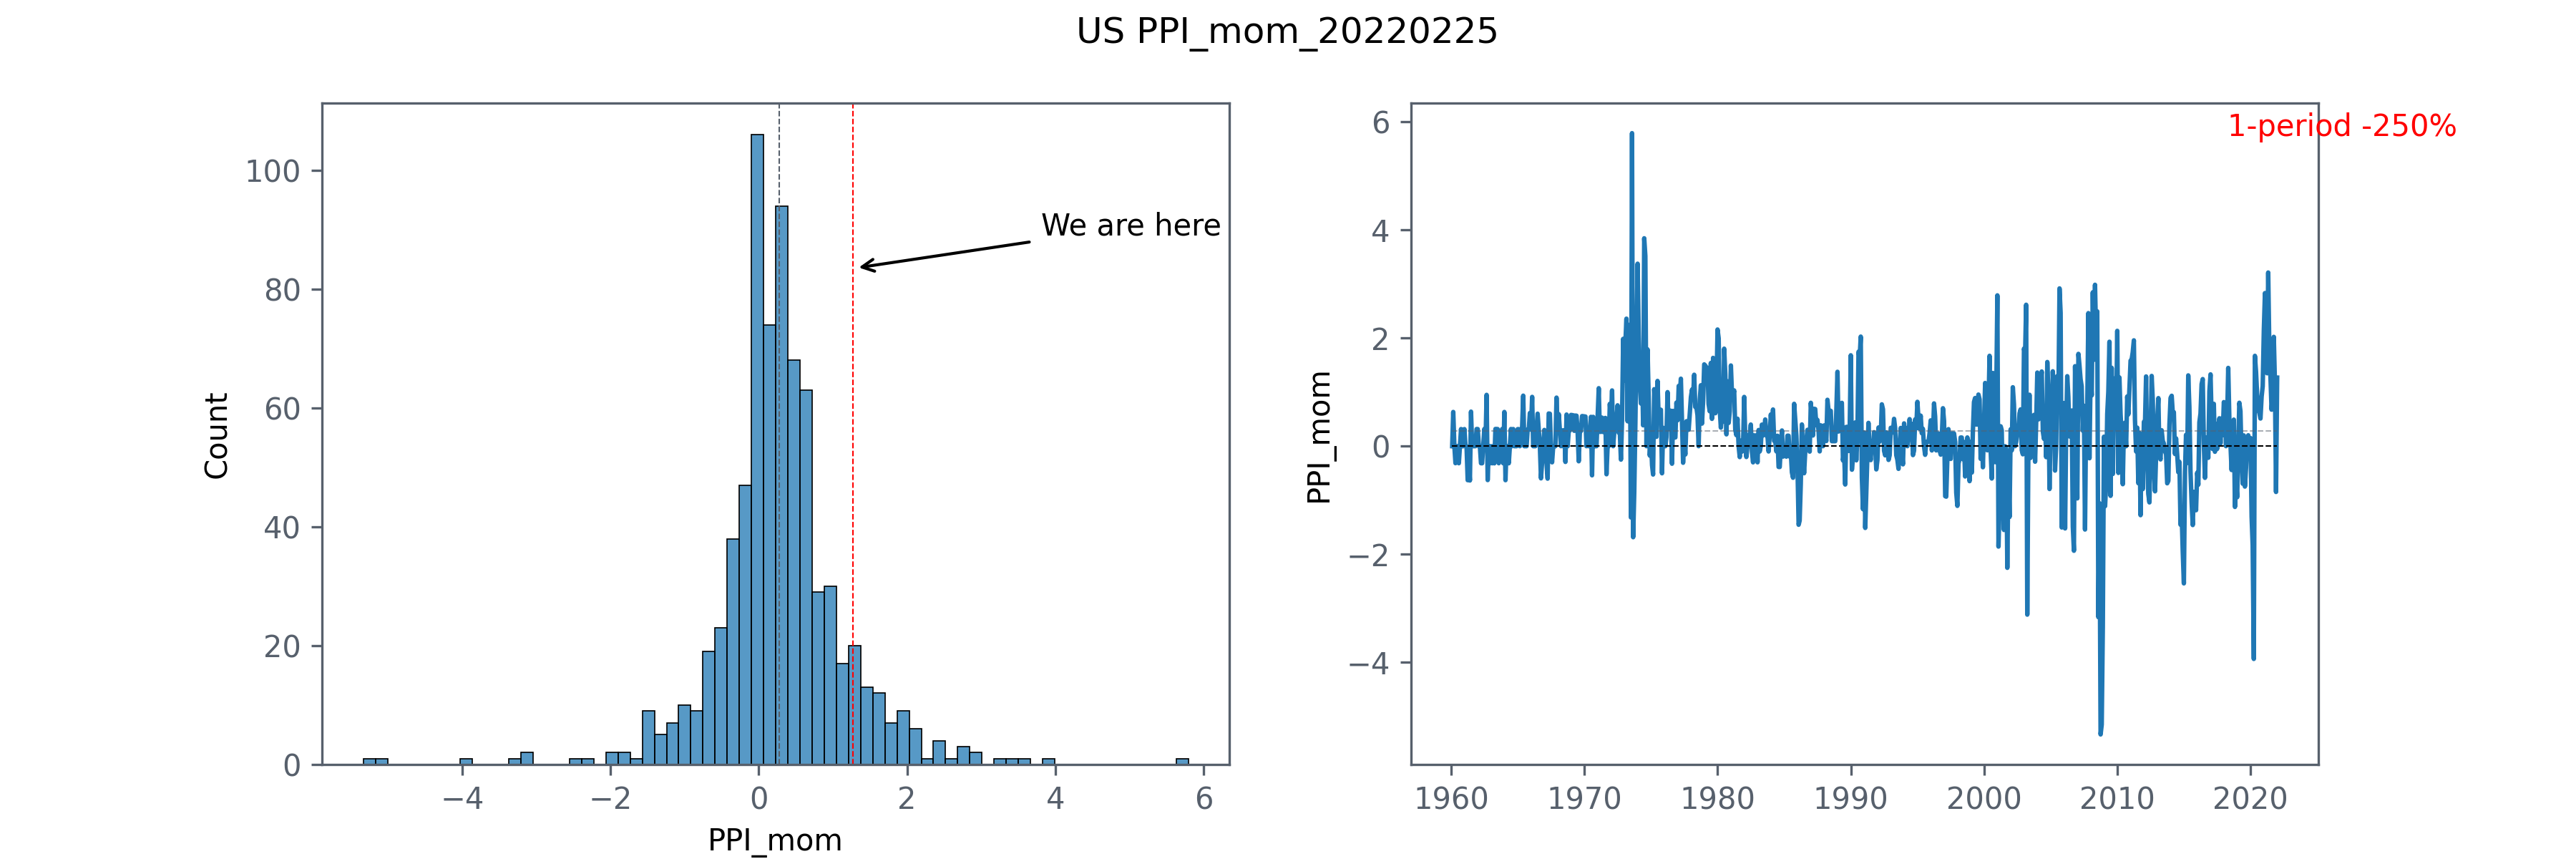
PPI Month over Month
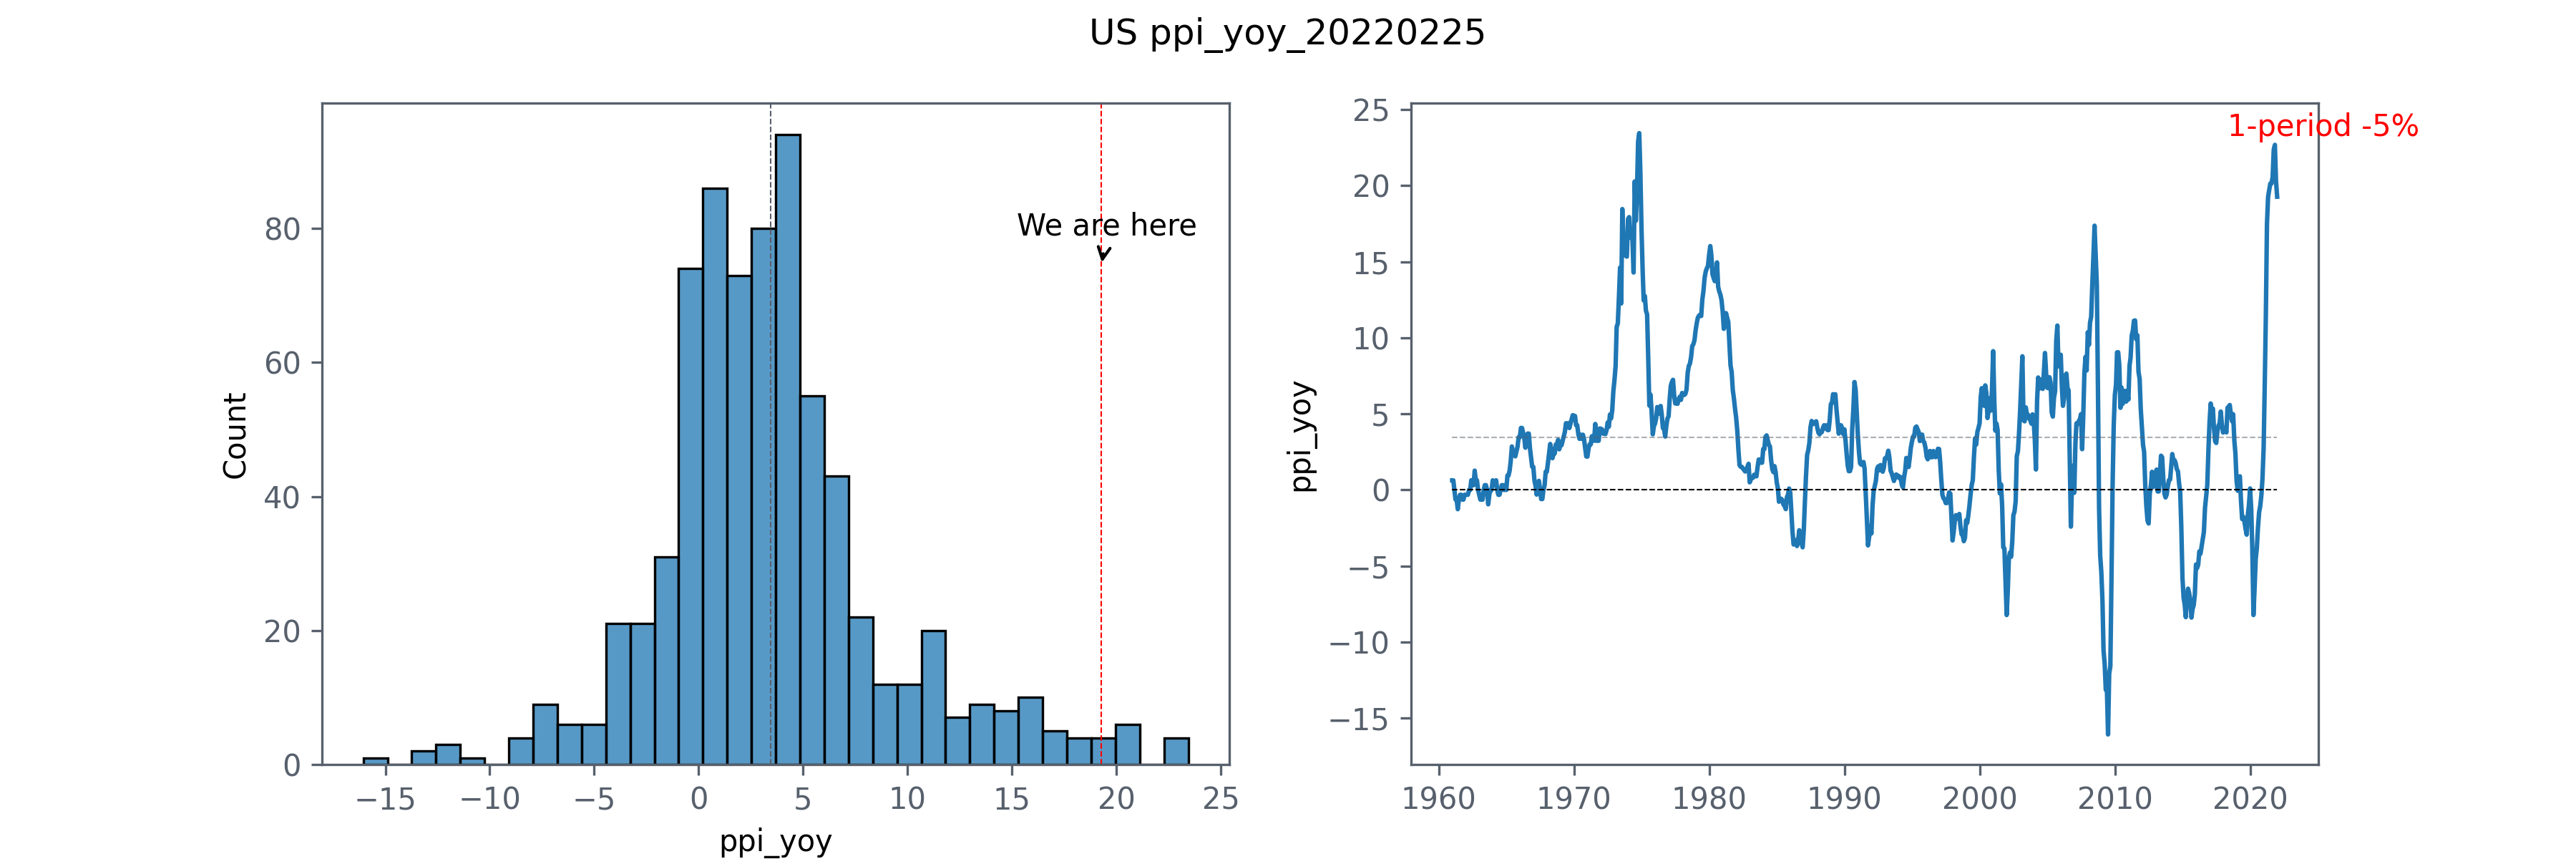
PPI Year over Year
| Date | ppi | PPI_mom | ppi_yoy |
|---|---|---|---|
| 2021-01-01 | 204.8 | 2.1 | 2.8 |
| 2021-02-01 | 210.6 | 2.8 | 7.1 |
| 2021-03-01 | 215 | 2.1 | 11.3 |
| 2021-04-01 | 217.9 | 1.3 | 17.5 |
| 2021-05-01 | 224.9 | 3.2 | 19.2 |
| 2021-06-01 | 228.9 | 1.8 | 19.7 |
| 2021-07-01 | 231.8 | 1.3 | 20.1 |
| 2021-08-01 | 233.4 | 0.7 | 20.1 |
| 2021-09-01 | 235.7 | 1 | 20.6 |
| 2021-10-01 | 240.4 | 2 | 22.4 |
| 2021-11-01 | 243.3 | 1.2 | 22.7 |
| 2021-12-01 | 241.2 | -0.8 | 20.3 |
| 2022-01-01 | 244.3 | 1.3 | 19.3 |
The max happens on  PPI_mom   1973-08-01
dtype: datetime64[ns]
            PPI_mom
DATE
1973-08-01    5.791
The min happens on  PPI_mom   2008-10-01
dtype: datetime64[ns]
            PPI_mom
DATE
2008-10-01   -5.333
| Date | hpi_qoq | Max_min | Date | hpi_yoy | Max_min |
|---|---|---|---|---|---|
| 2021-07-01 | 5.58 | Max | 2021-10-01 | 17.86 | Max |
| 2008-07-01 | -3.15 | min | 2008-10-01 | -7.14 | min |
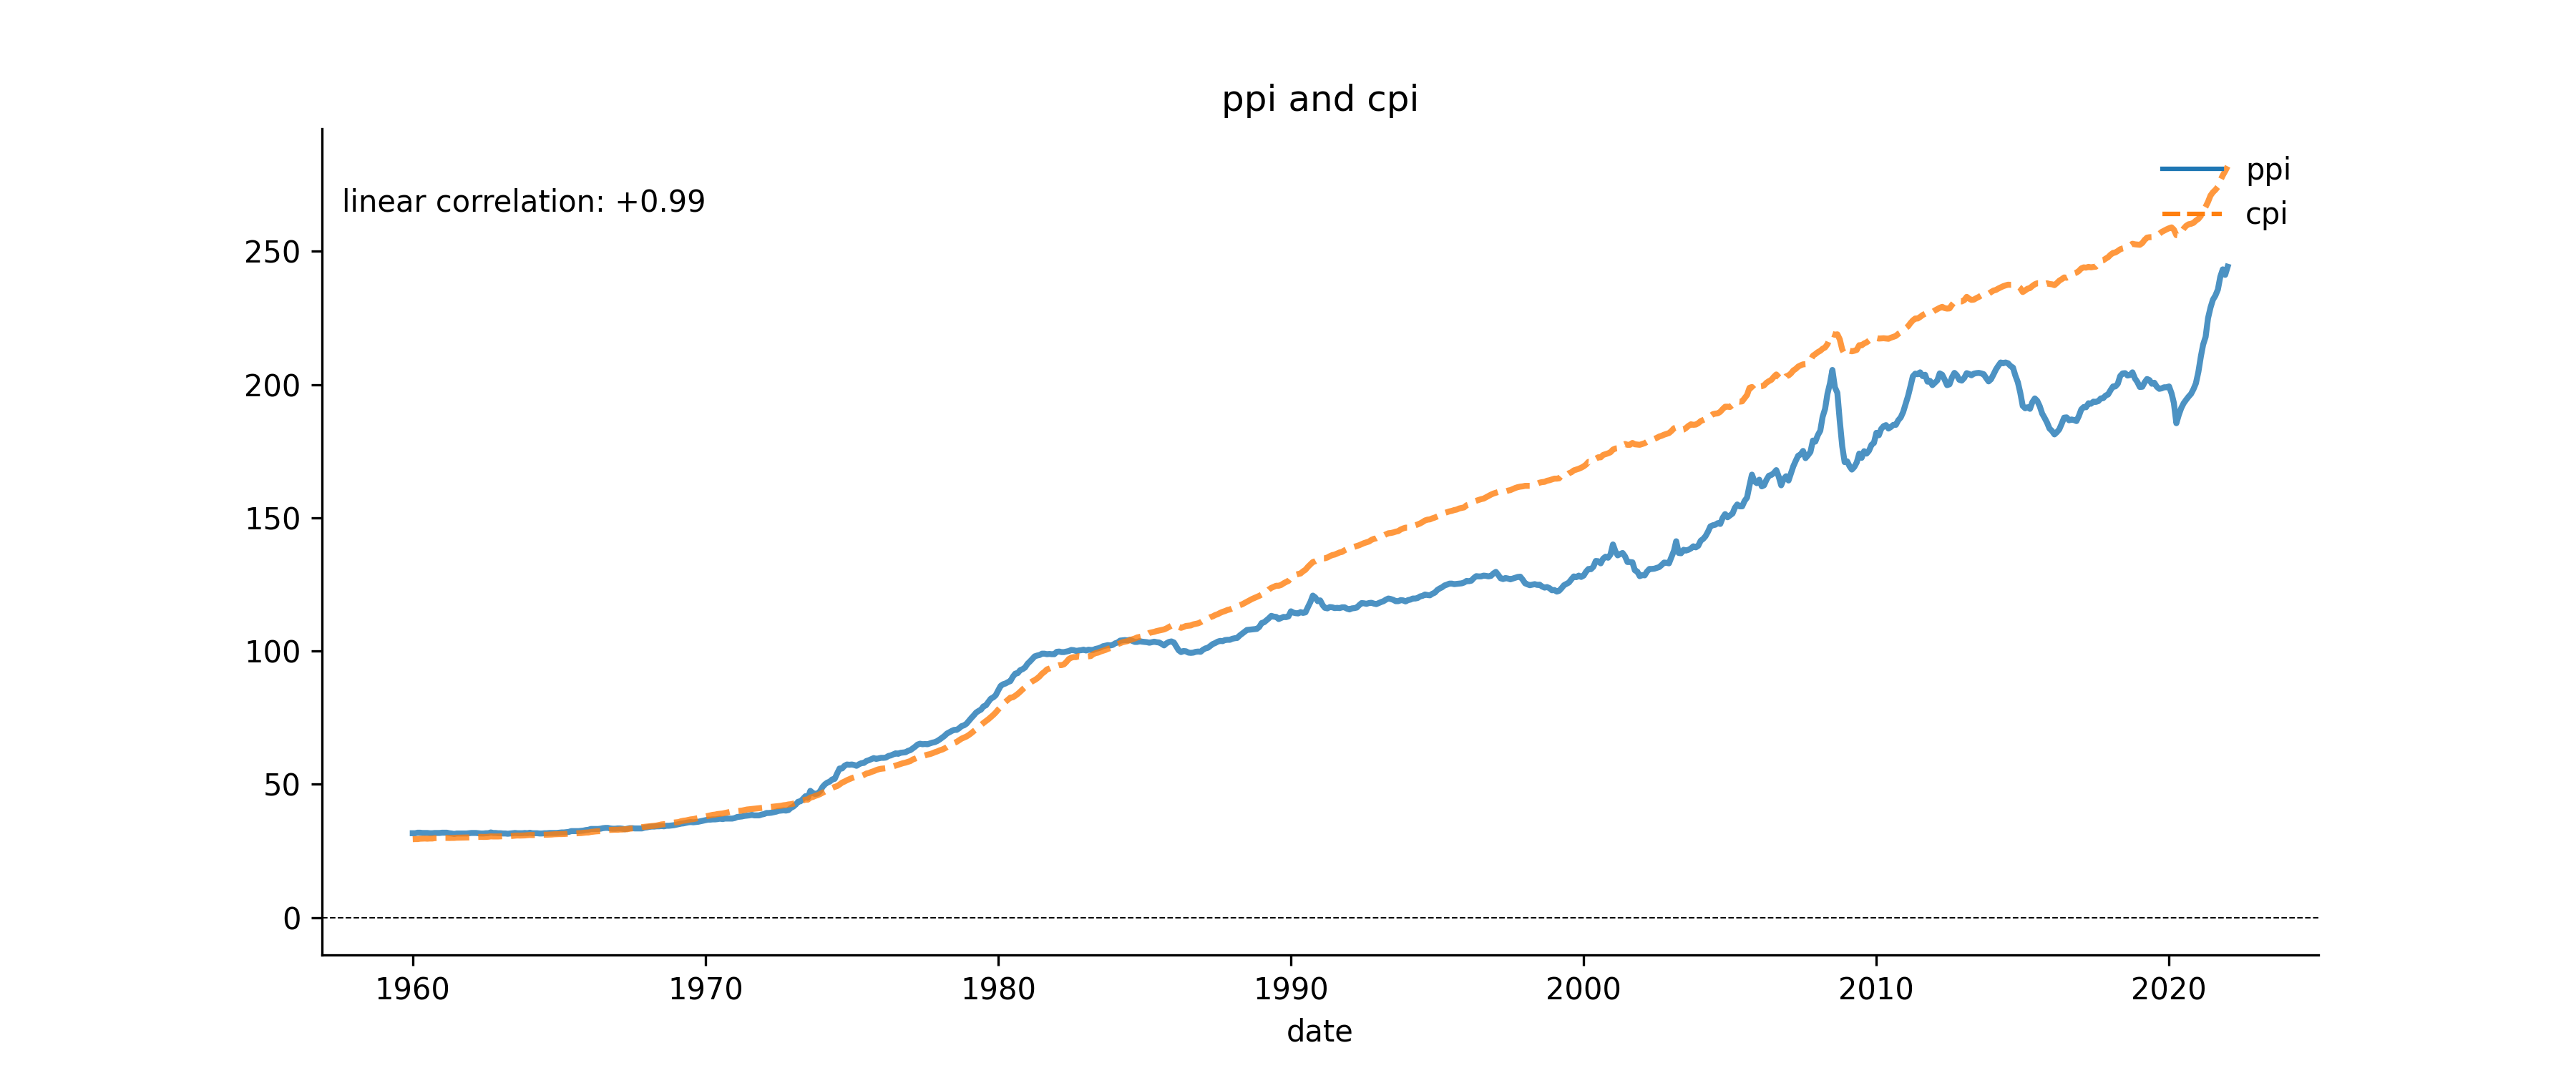
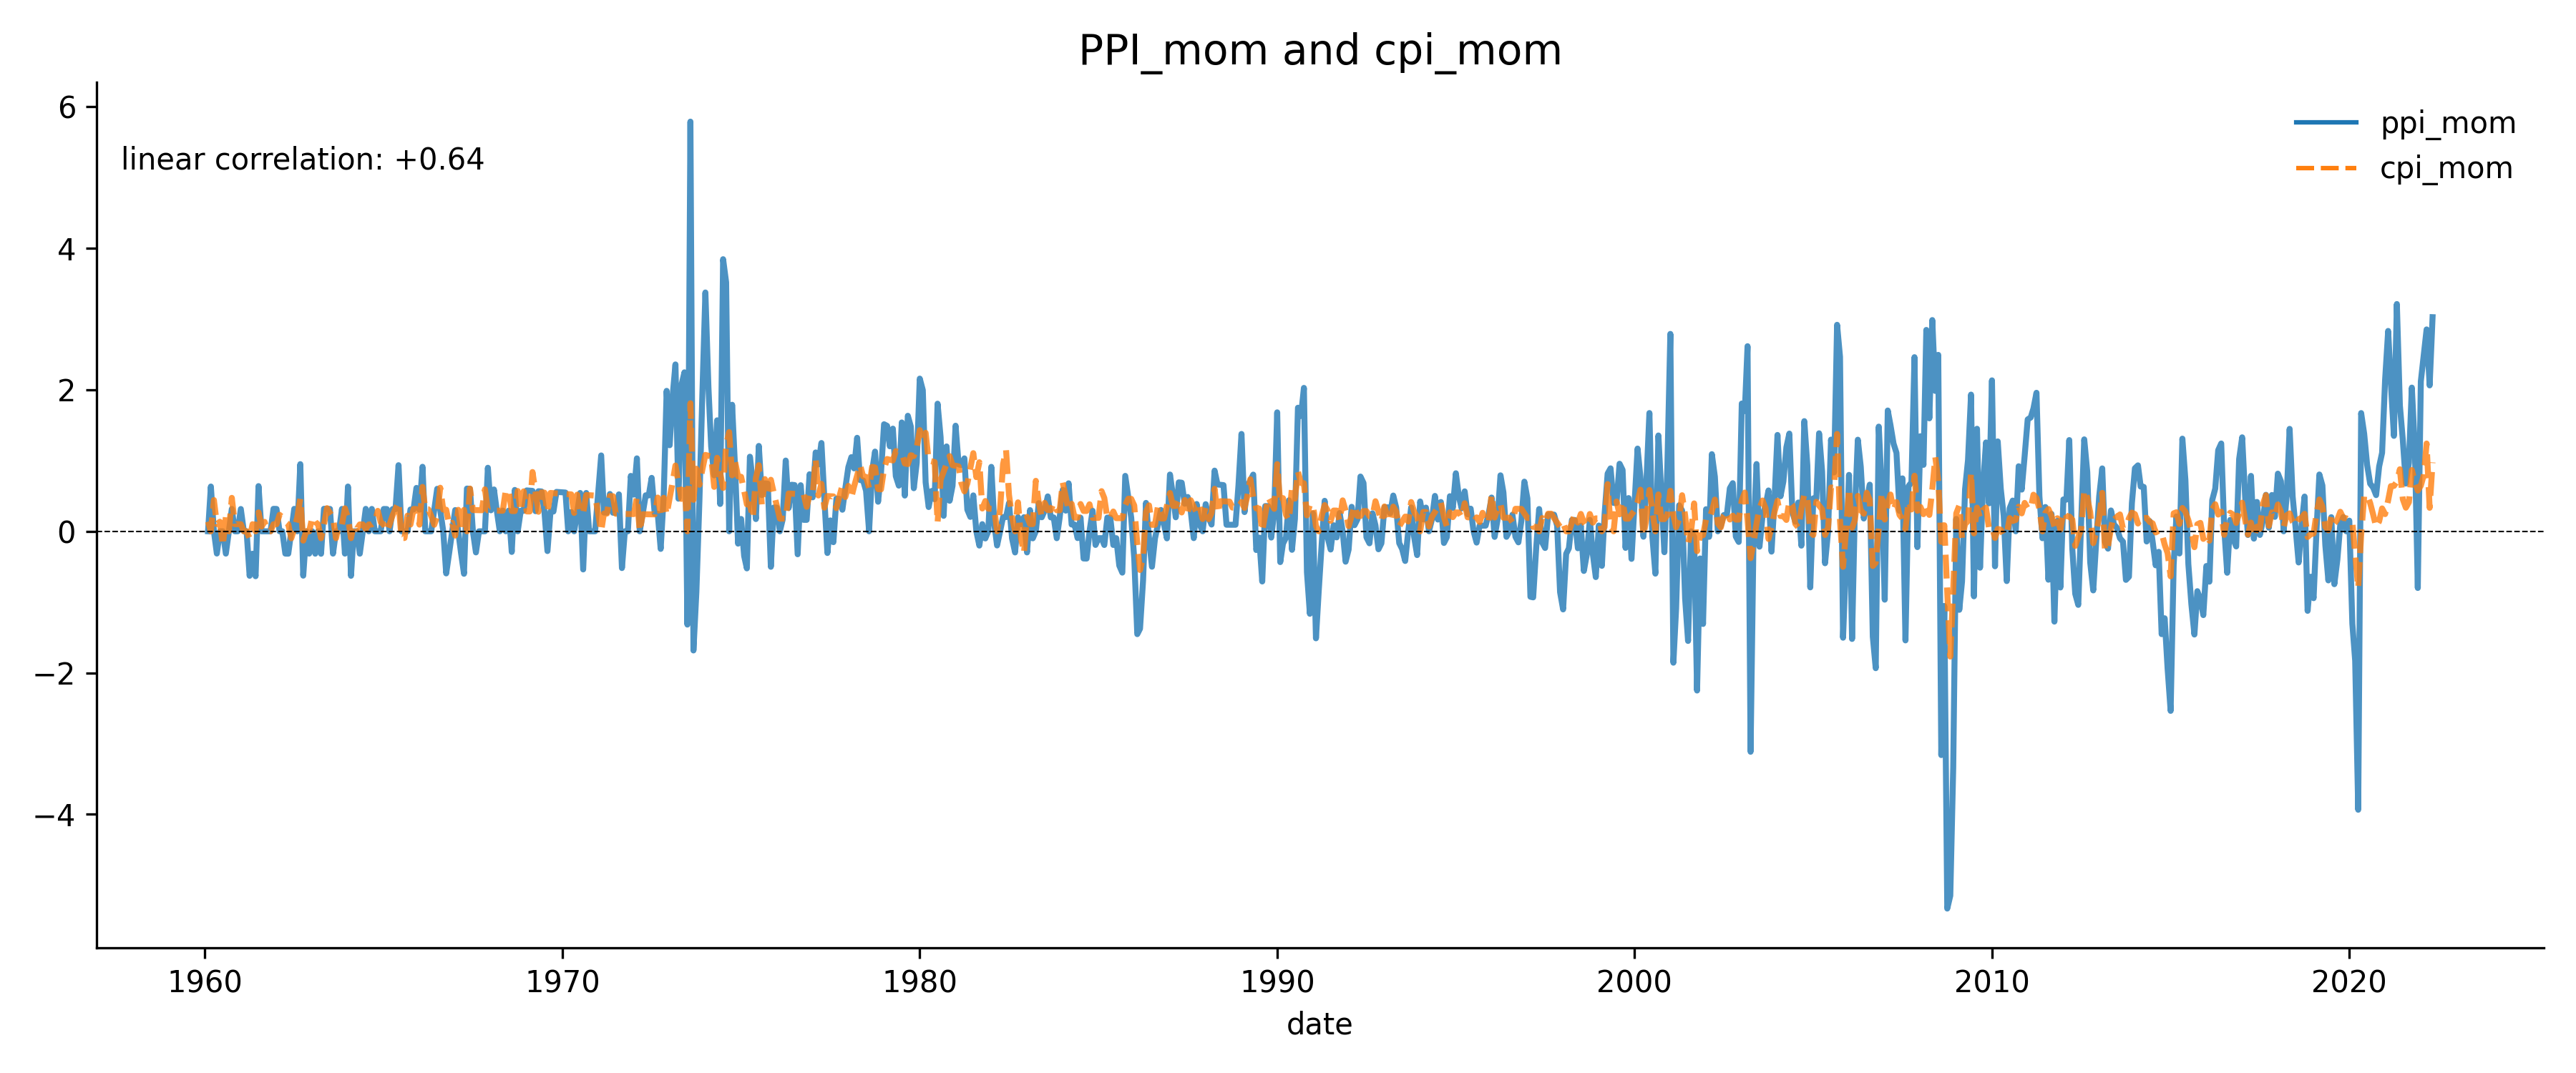
cpi and ppi
cpi_mom and ppi_mom all data
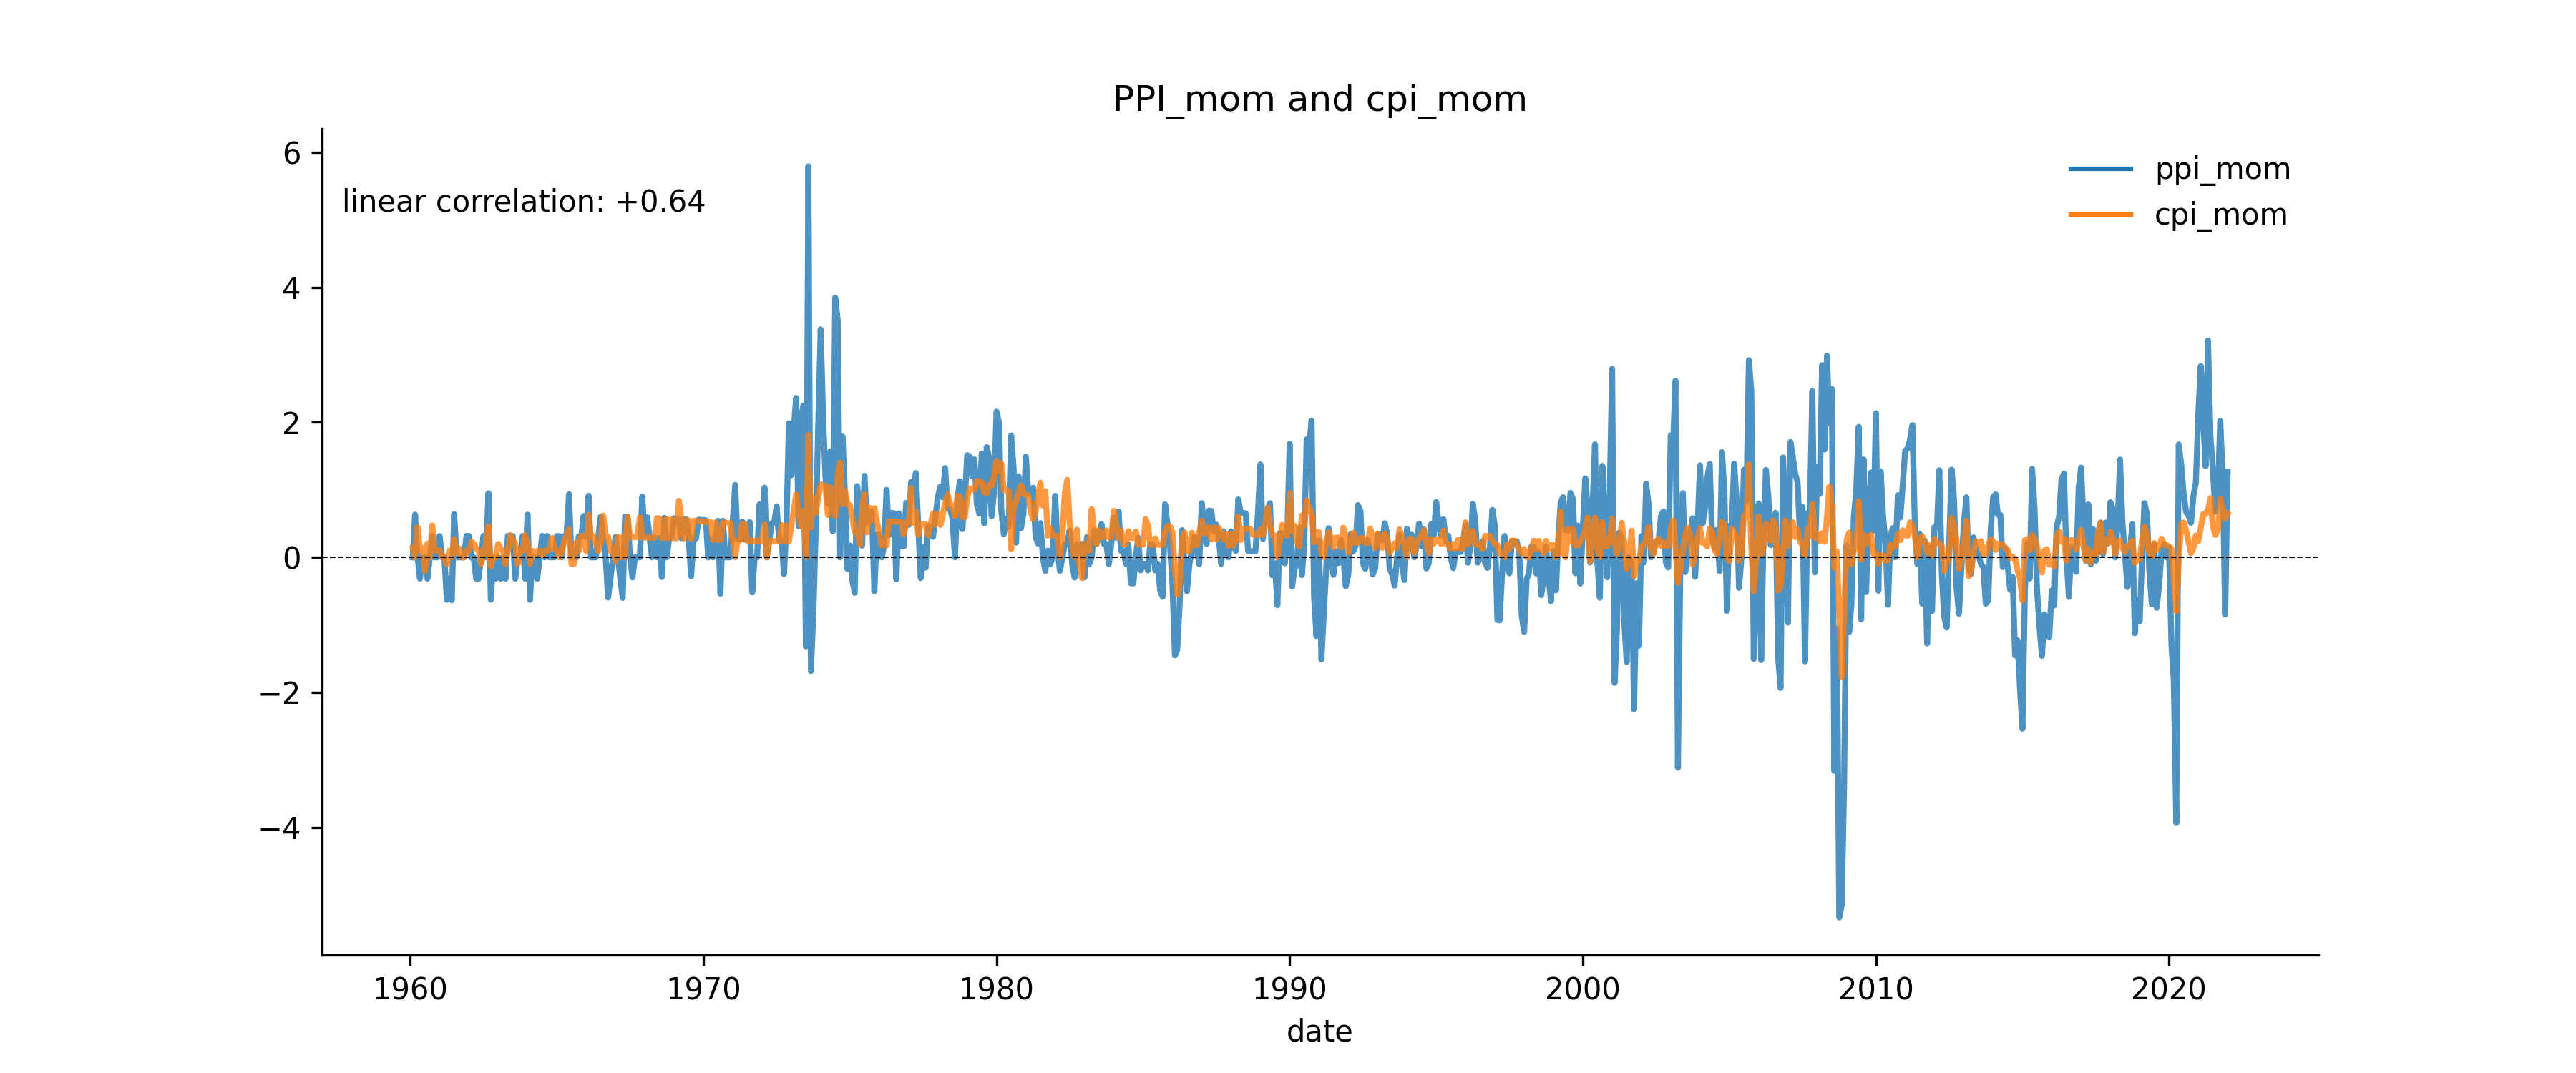
The chart above has a long history and it is hard to see. So, we take a shorter span.
cpi_mom and ppi_mom since 2006
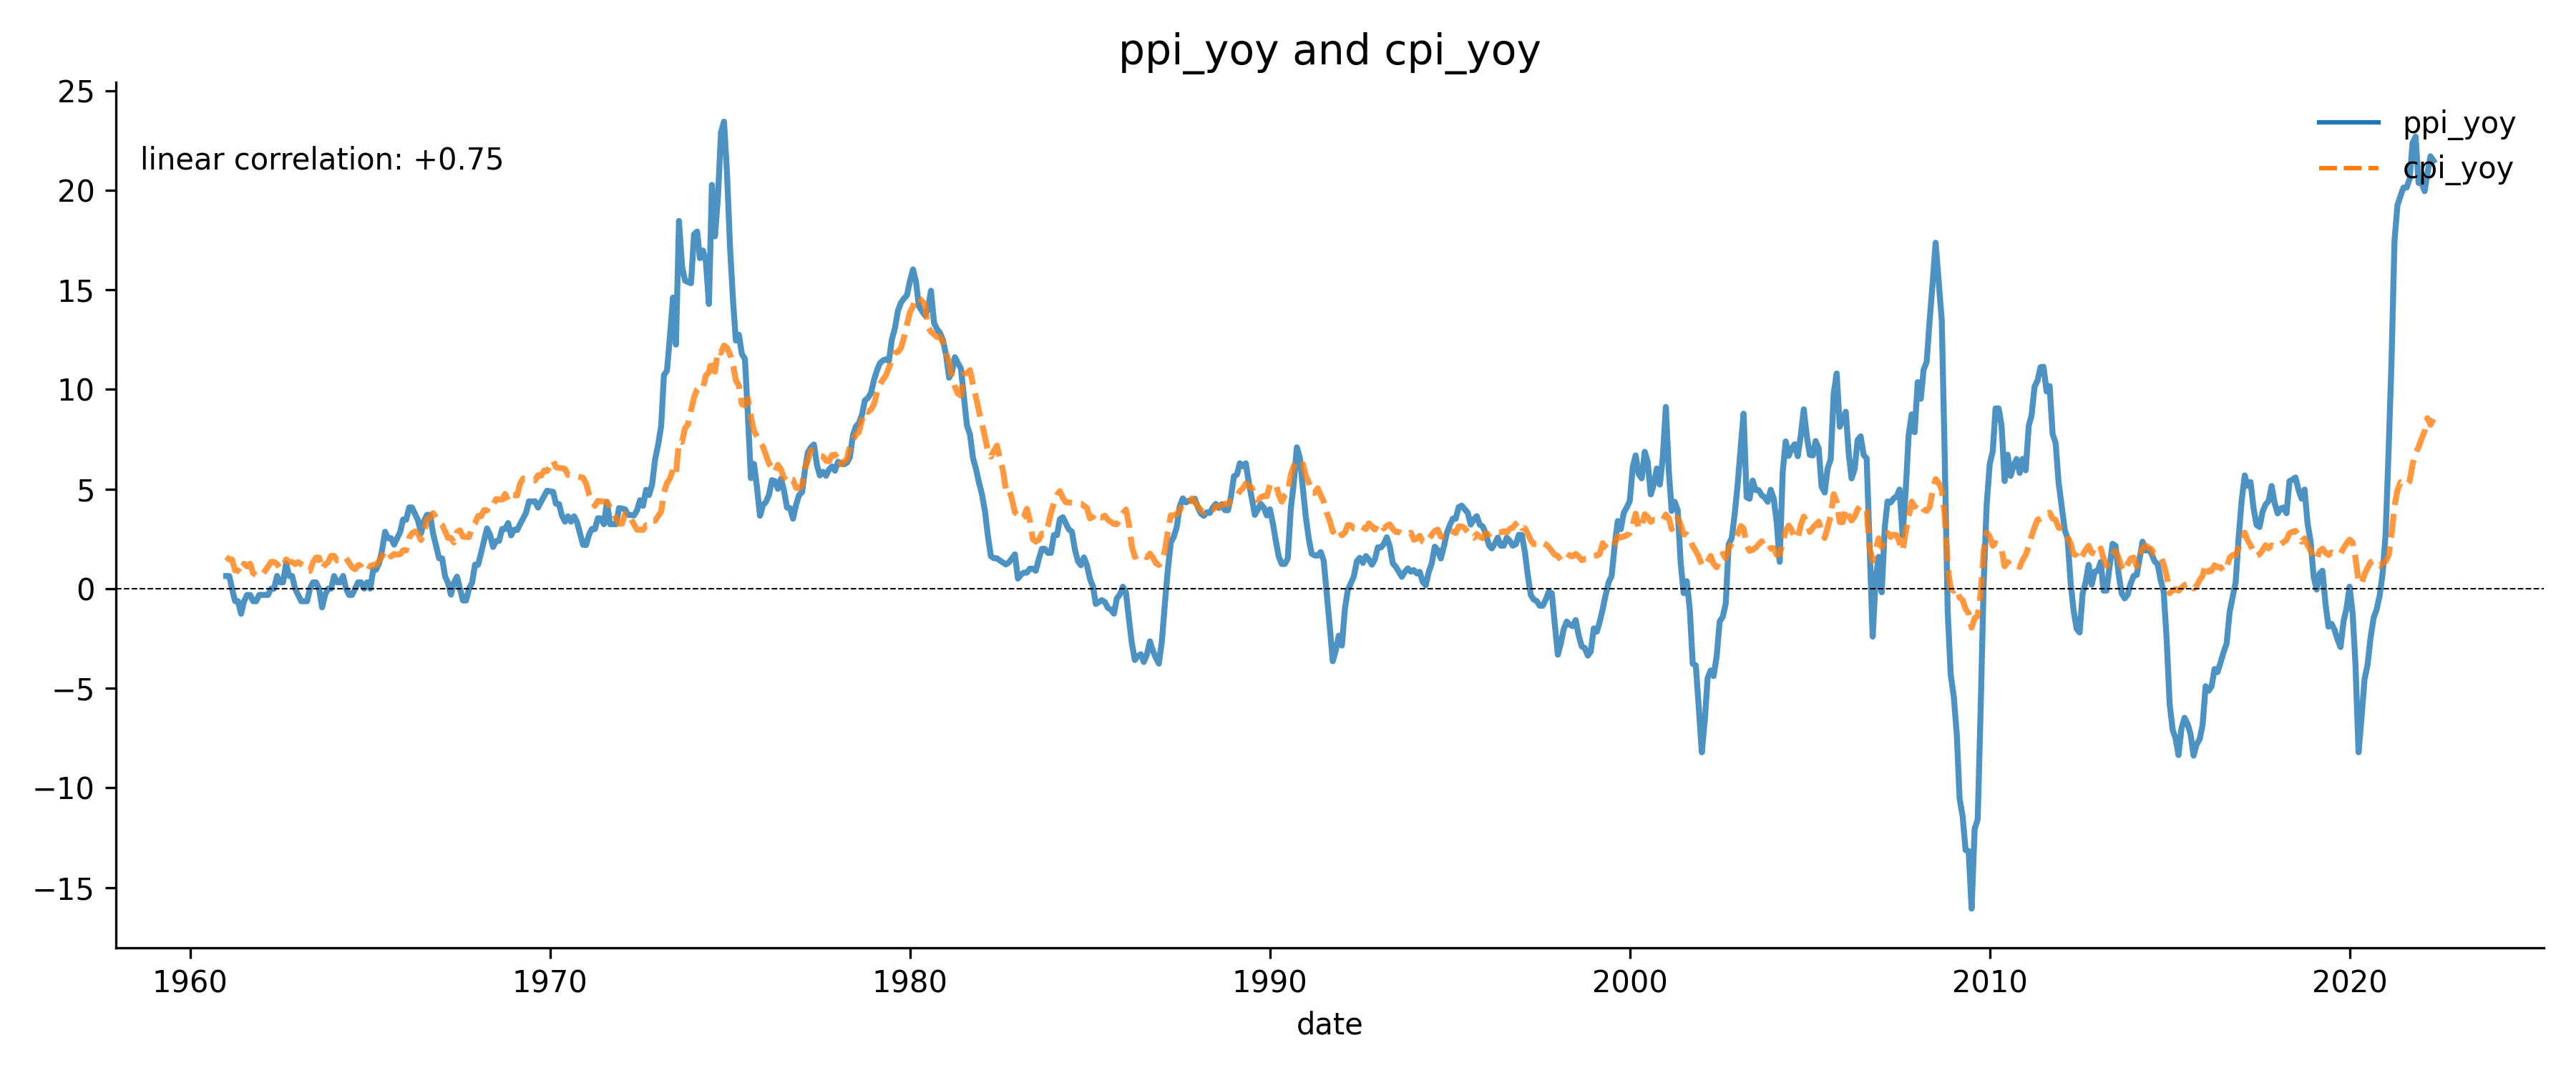
cpi_yoy and ppi_yoy
wti and commodities and cpi
WTI and global commodities seem to have some cyclicality, whereas the CPI has a very strong trend, which is so strong that any cyclicality is not visible from the chart.
This tells that although rising oil and commodity prices can be a driver for inflation, but it is definitely not THE driver, nor the only driver. The real drivers are truly too much money and too much spending/demand relative to production.
This also tells that oil and commodities are subject to the law of demand and supply and have their cycles, as any industry. For instance, the insurance or banking industries have their cycles (e.g. insurance underwriting cycle and banking credit cycle).
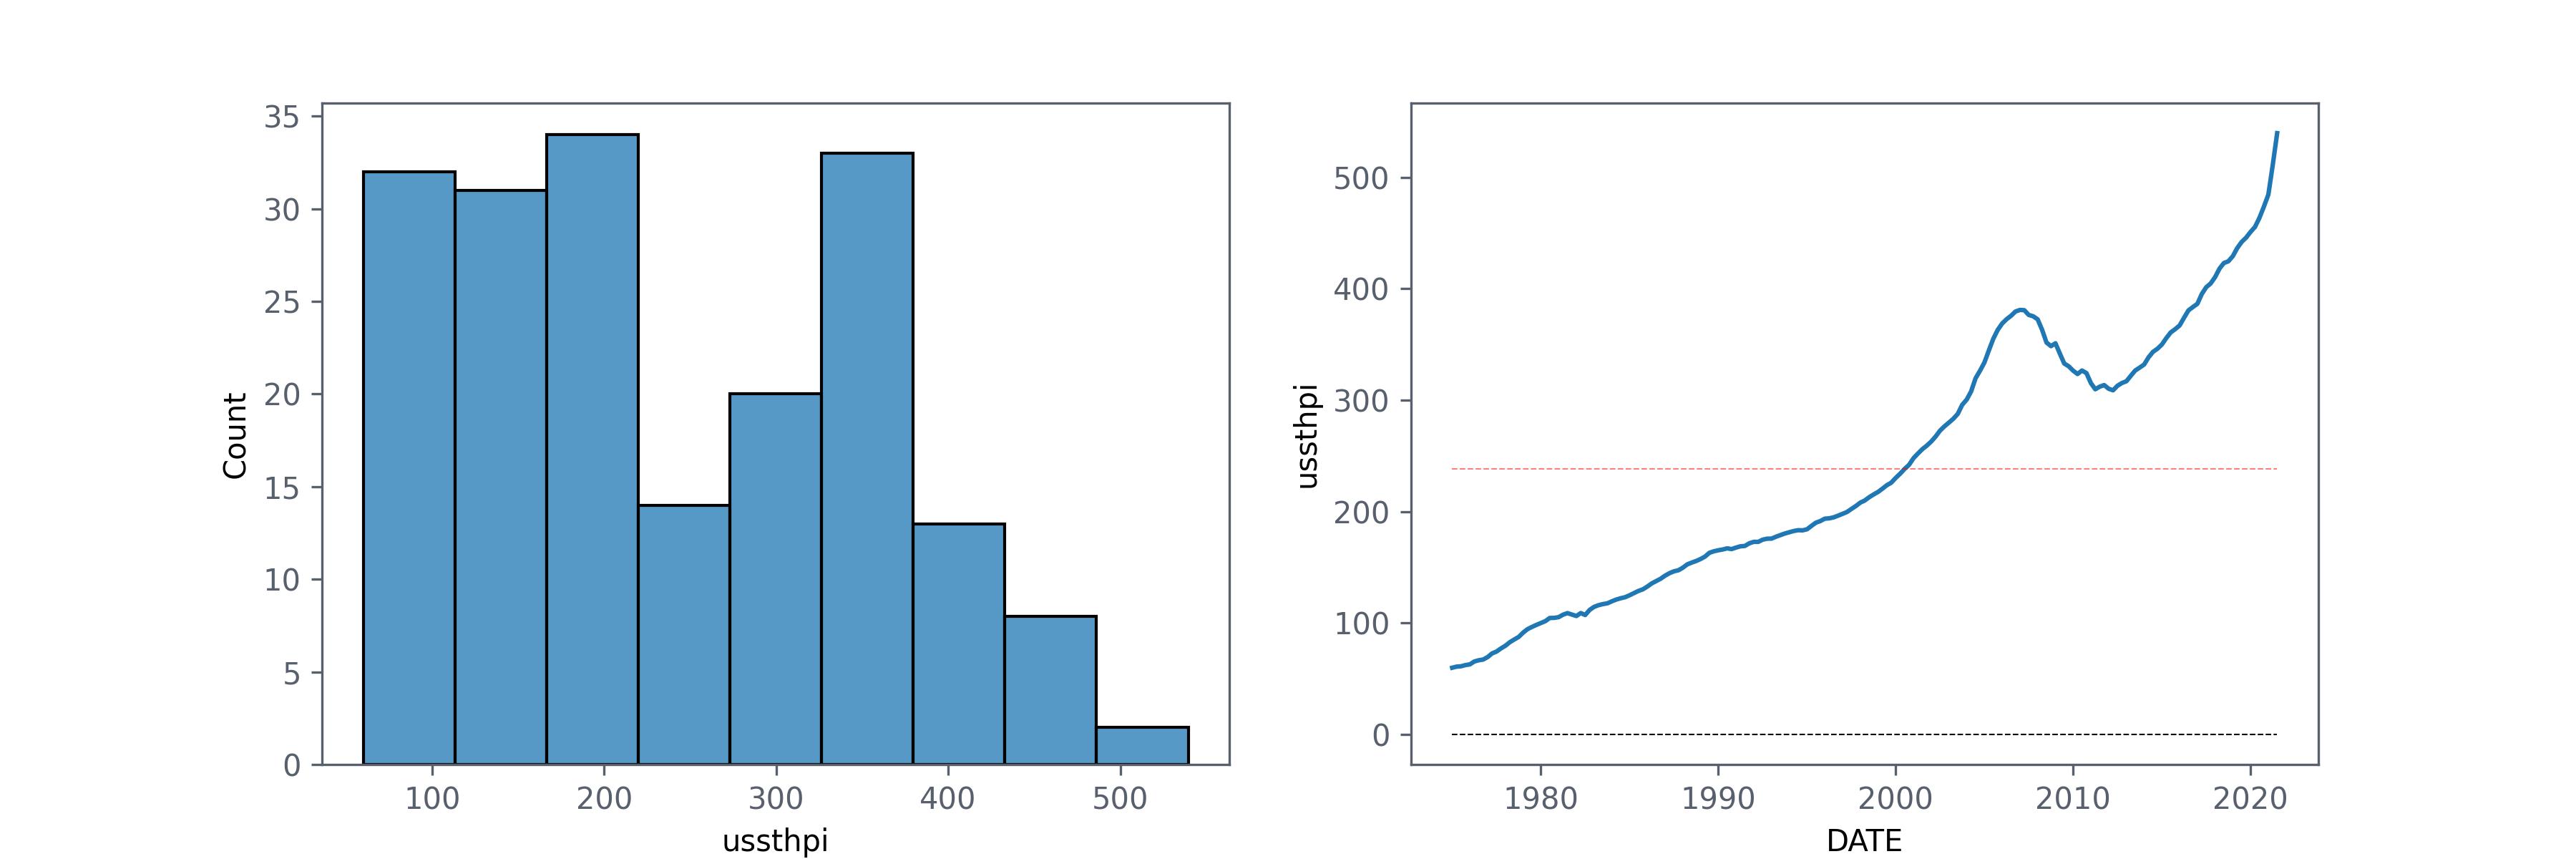
HPI
Because CPI does not include house prices, we need to look at HPI to get a bigger picture, especially because housing price is a big part of where people spend their money.
The latest data is as of 4Q2021. Clearly in 2021 the prices rose dramatically.
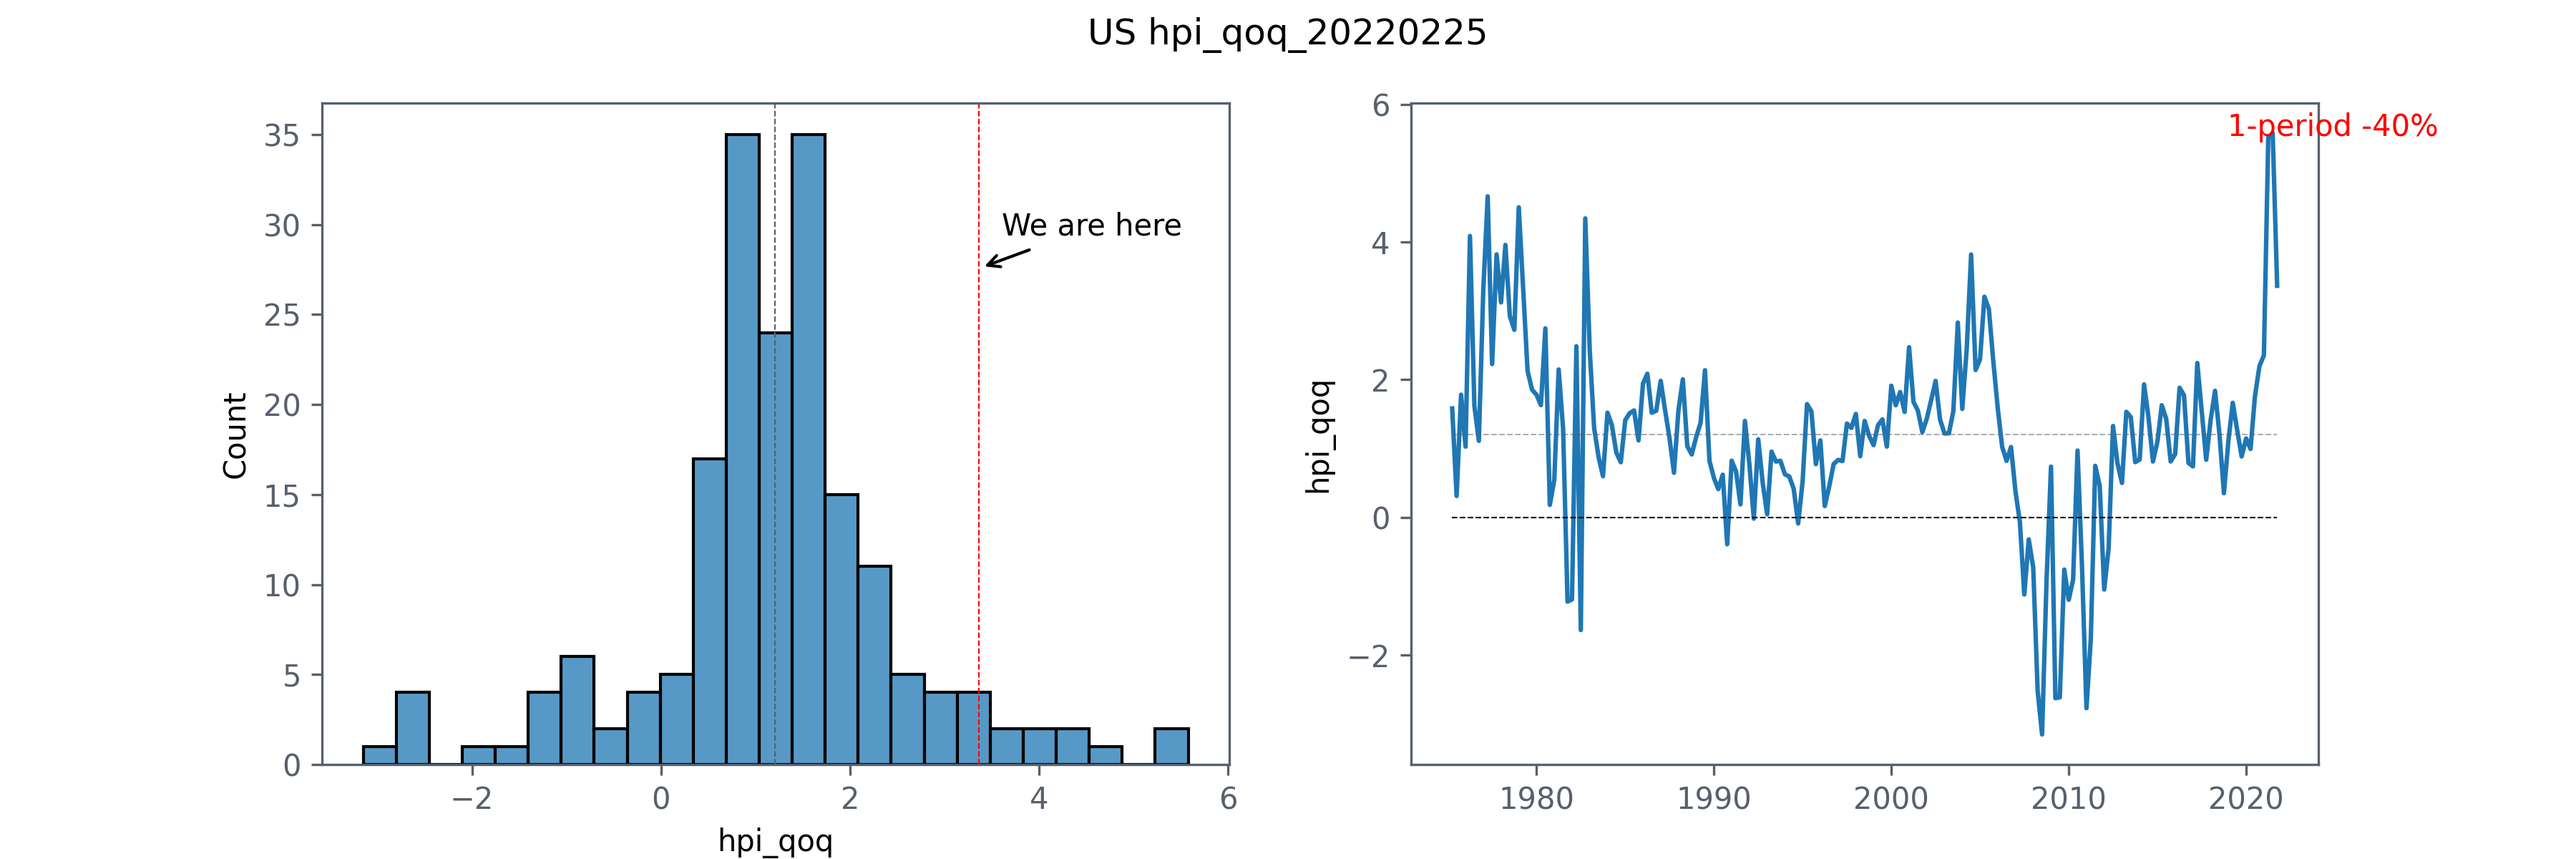
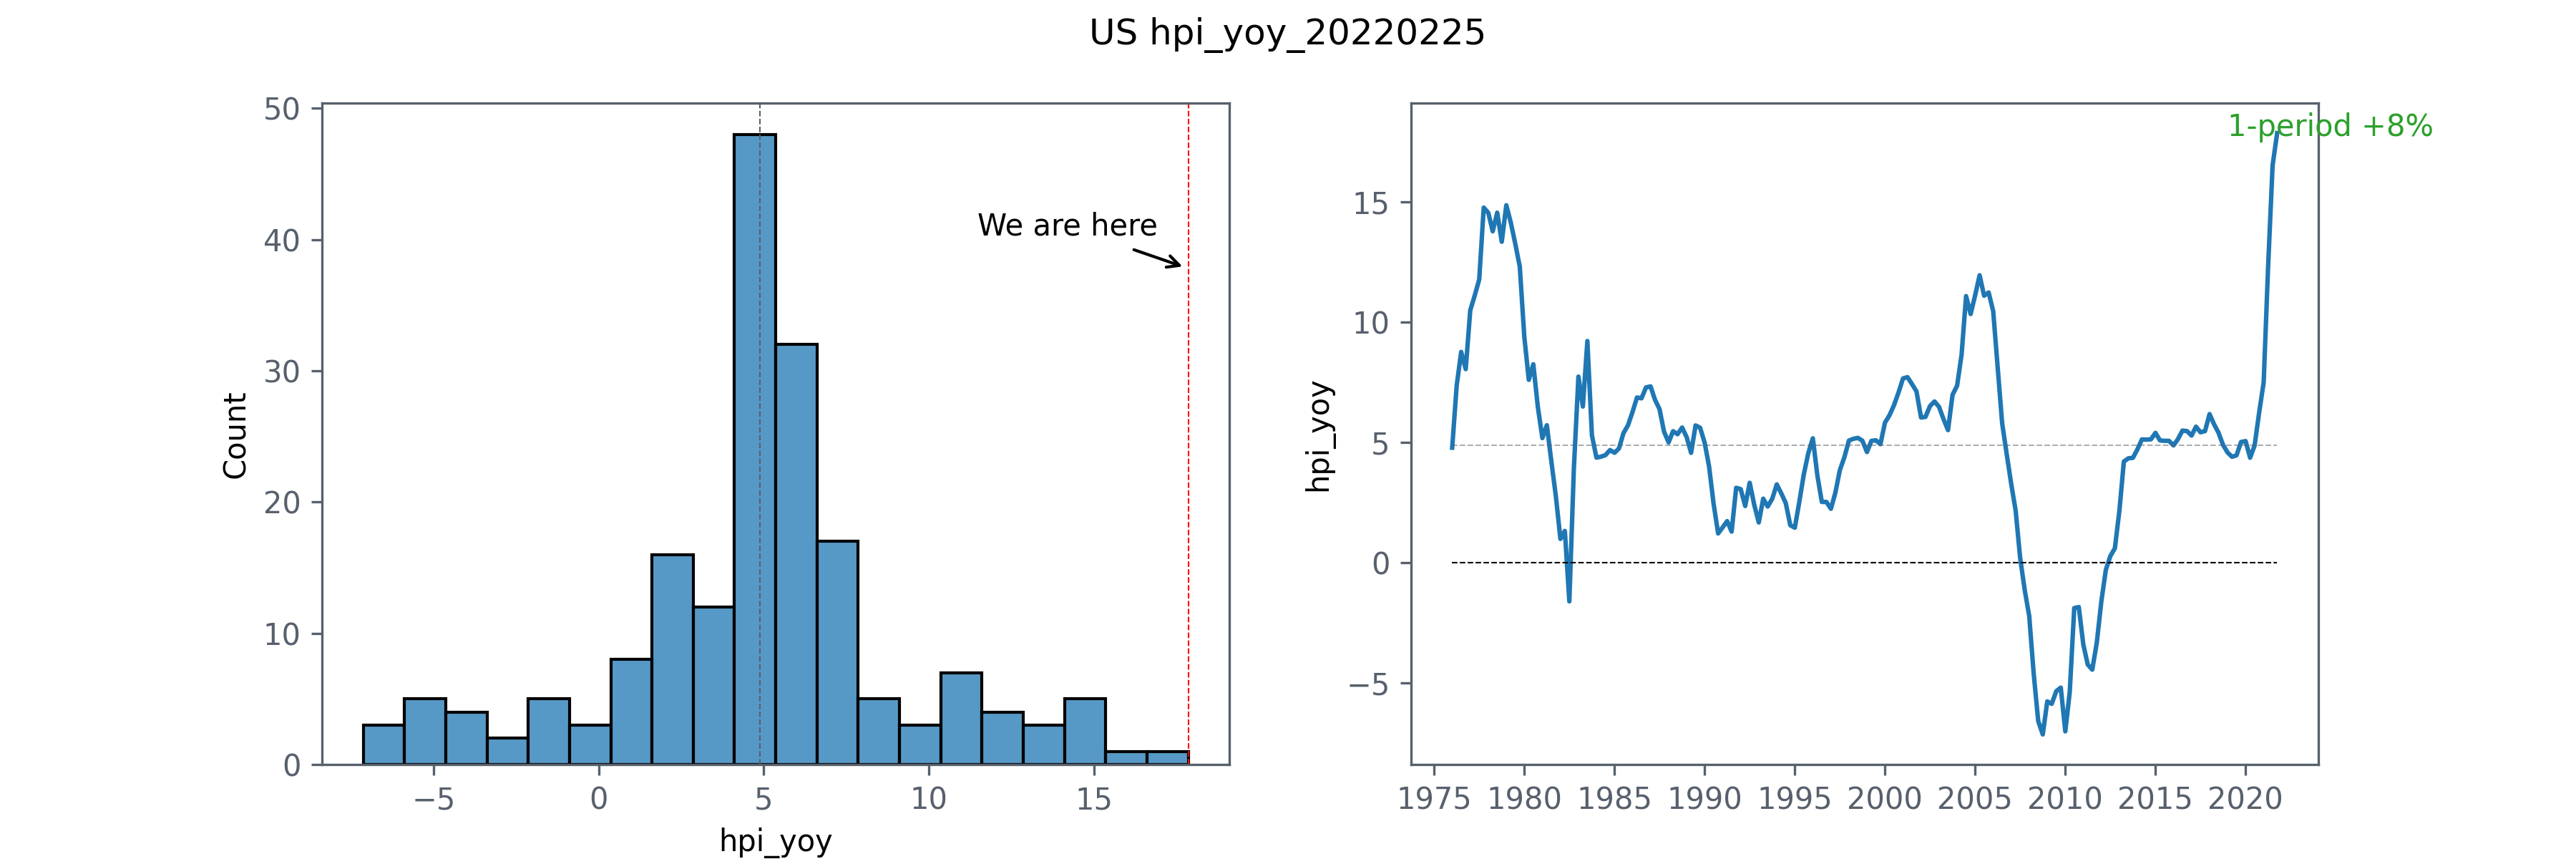
| hpi | hpi_qoq | hpi_yoy | |
|---|---|---|---|
| 2019-10-01 | 445.4 | 0.9 | 5 |
| 2020-01-01 | 450.6 | 1.1 | 5.1 |
| 2020-04-01 | 455 | 1 | 4.4 |
| 2020-07-01 | 463 | 1.8 | 4.9 |
| 2020-10-01 | 473.2 | 2.2 | 6.2 |
| 2021-01-01 | 484.4 | 2.4 | 7.5 |
| 2021-04-01 | 511.1 | 5.5 | 12.3 |
| 2021-07-01 | 539.6 | 5.6 | 16.5 |
| 2021-10-01 | 557.7 | 3.4 | 17.9 |
| Date | hpi_qoq | Max_min | Date | hpi_yoy | Max_min |
|---|---|---|---|---|---|
| 2021-07-01 | 5.58 | Max | 2021-10-01 | 17.86 | Max |
| 2008-07-01 | -3.15 | min | 2008-10-01 | -7.14 | min |
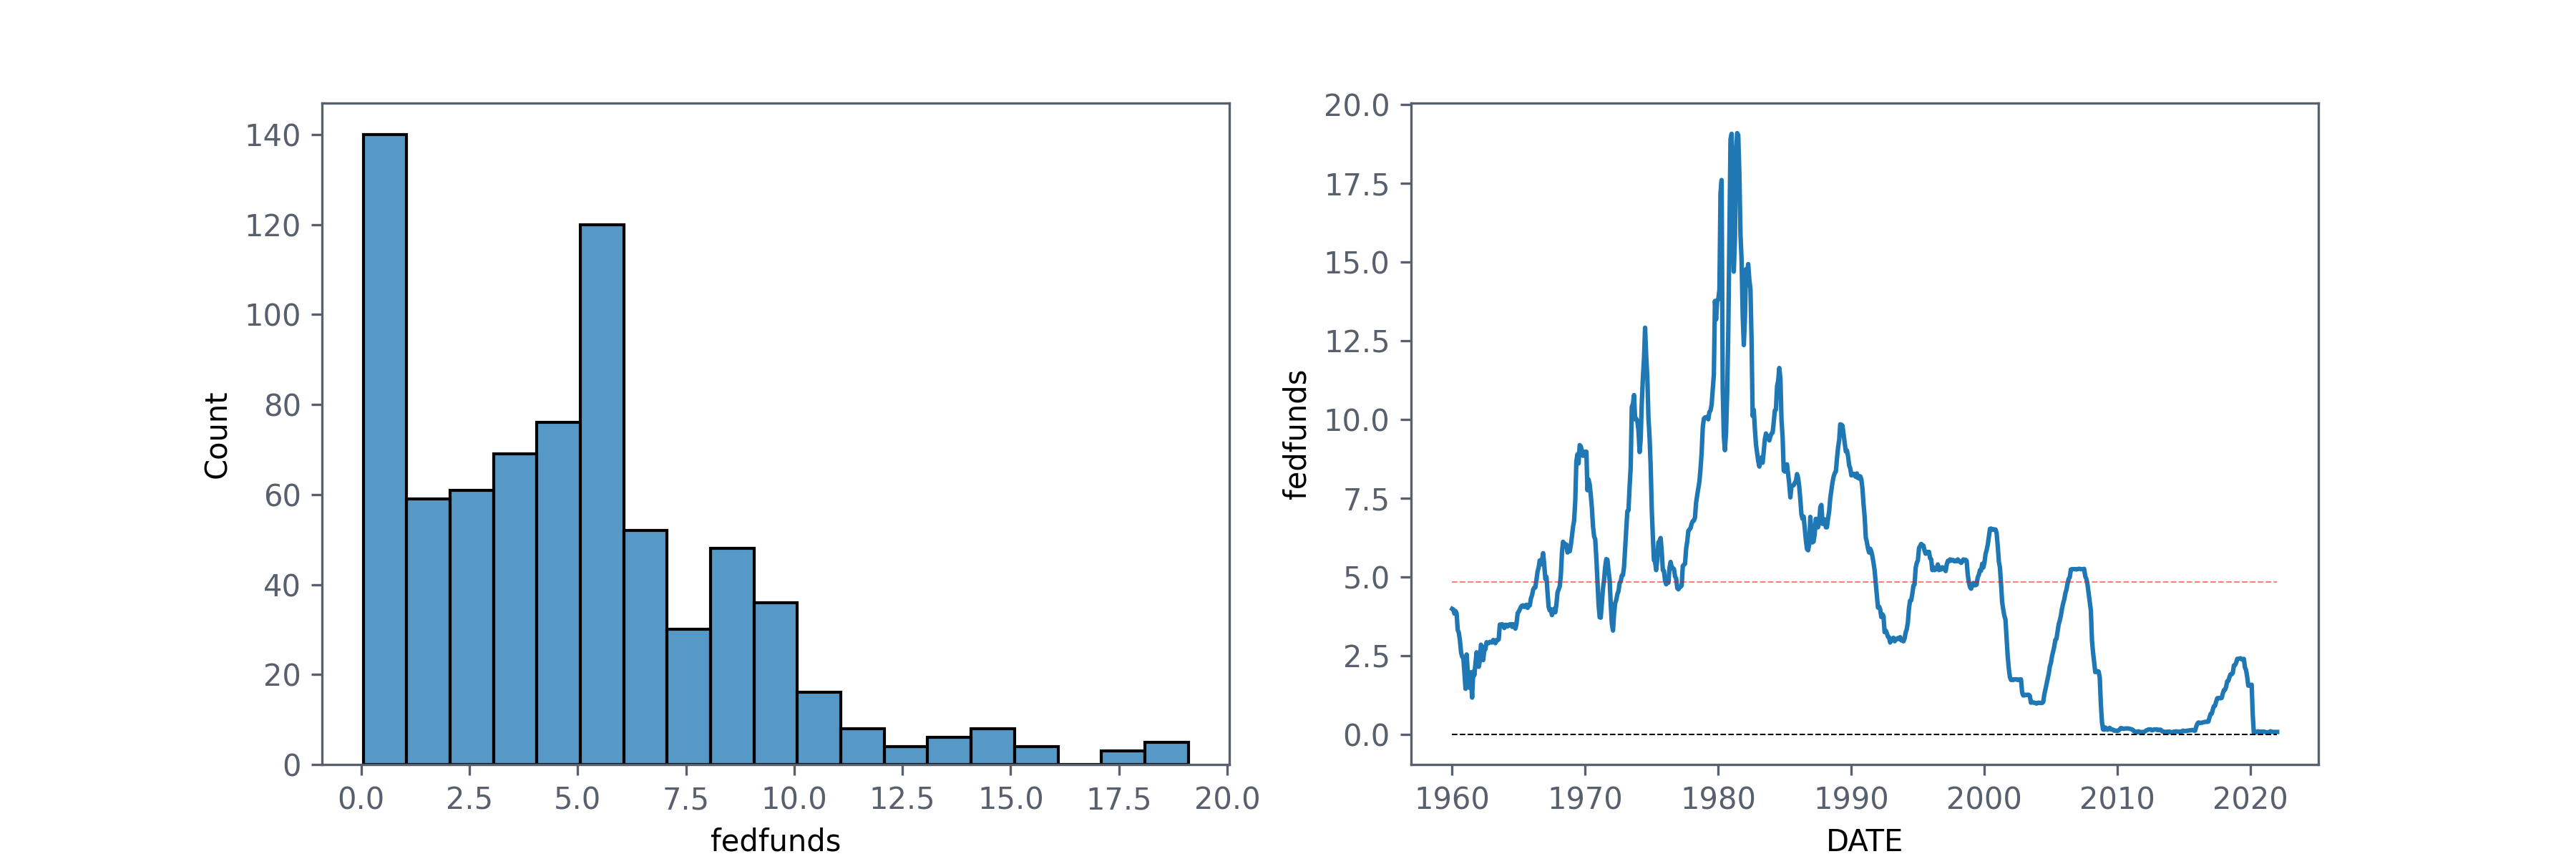
3. RATES
Fed funds rate
MEV = ‘FEDFUNDS’ NAME = ‘fedfunds’
Fed funds rate Month over Month
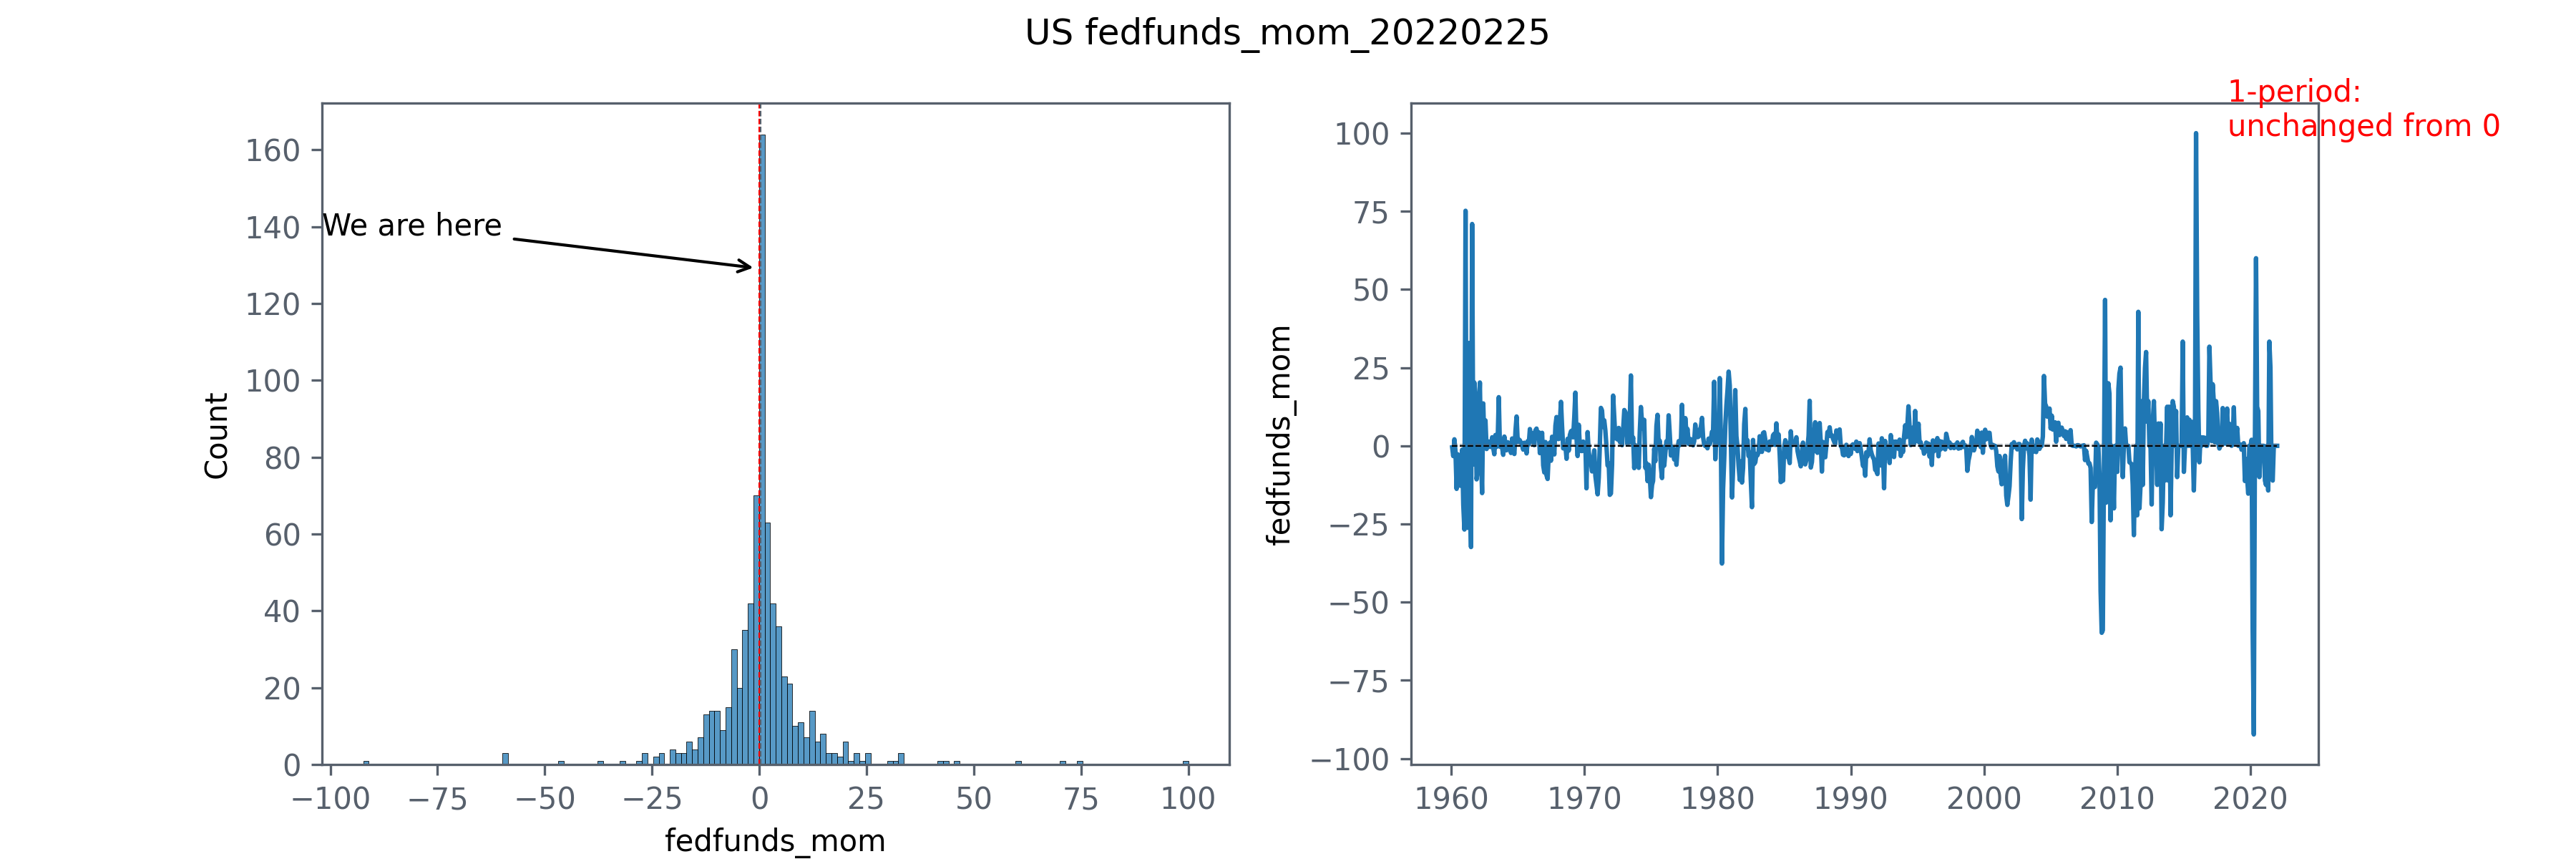
Fed funds rate Year over Year
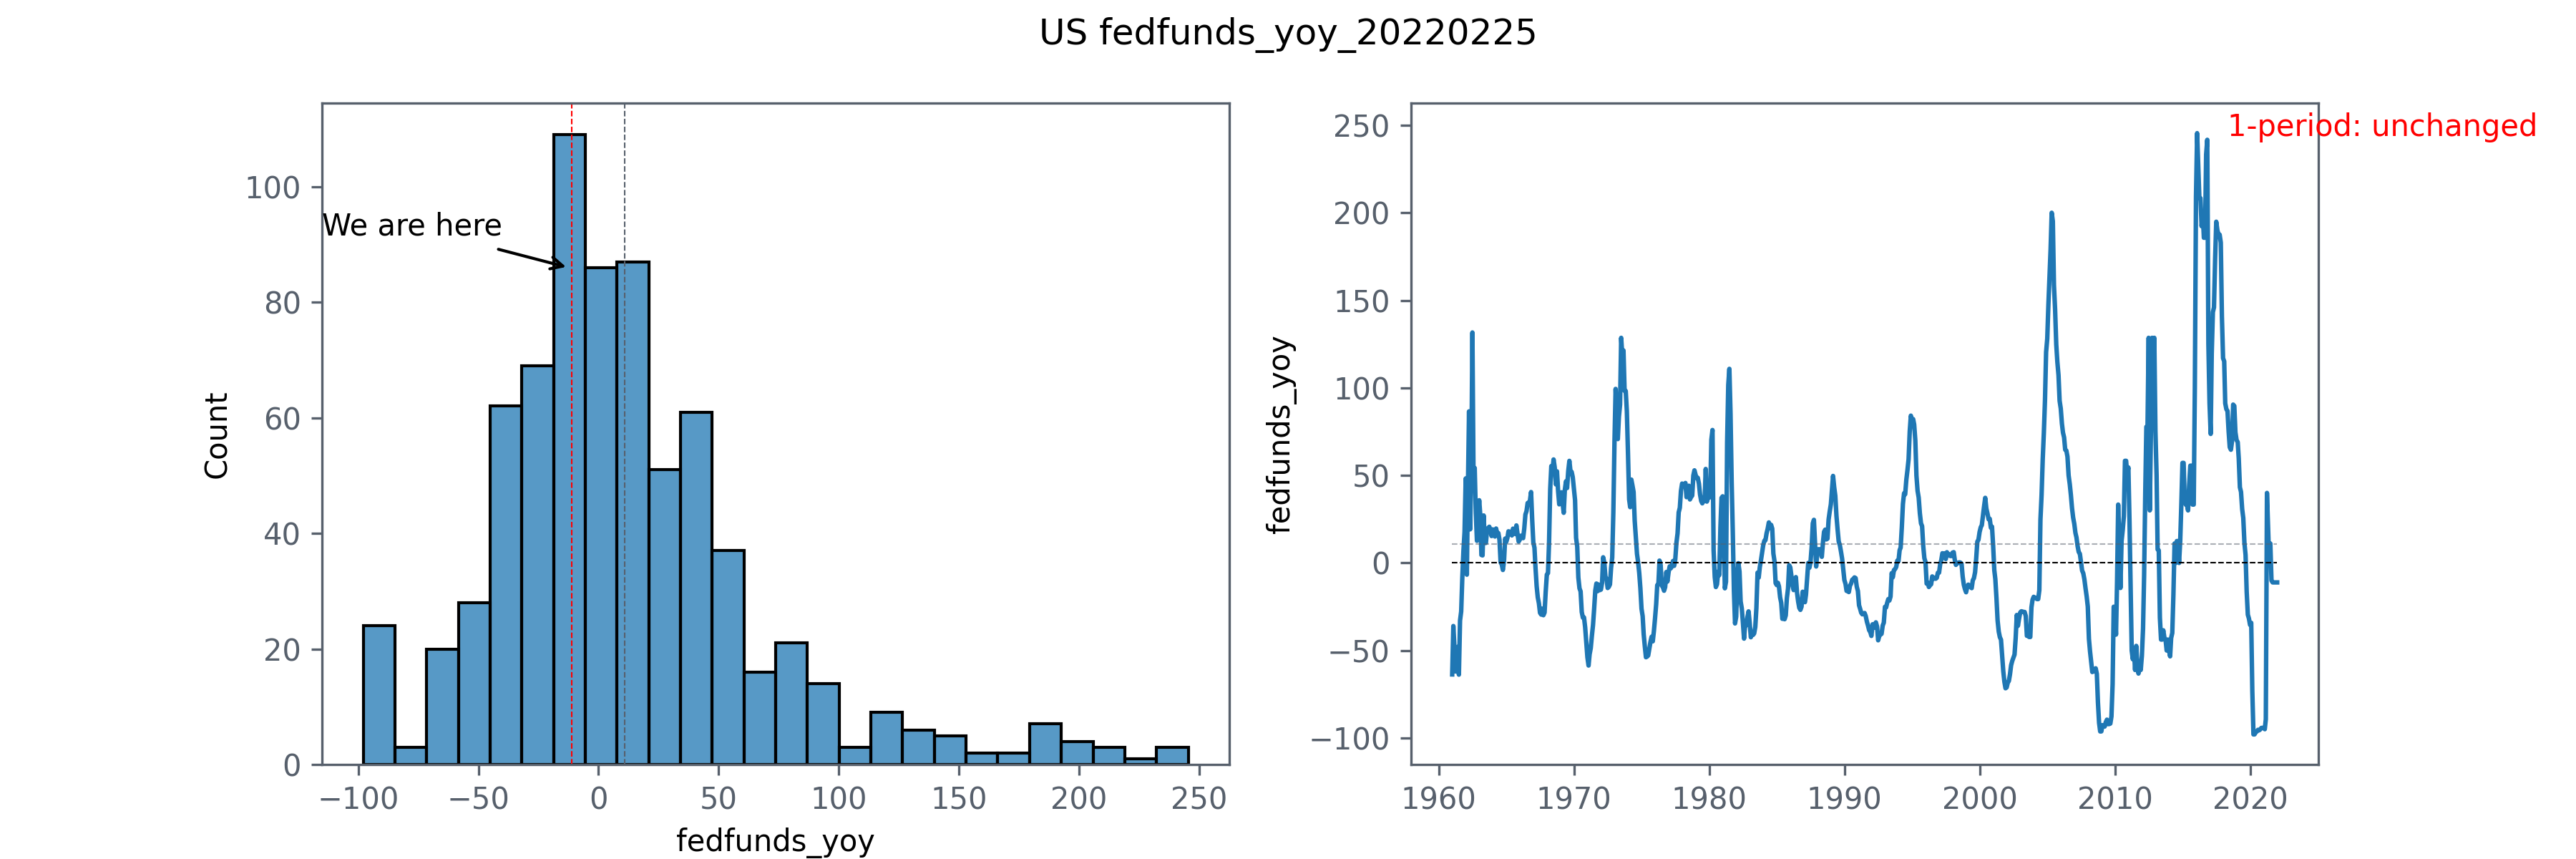
| fedfunds | fedfunds_mom | fedfunds_yoy | |
|---|---|---|---|
| 2021-01-01 | 0.09 | 0 | -94.194 |
| 2021-02-01 | 0.08 | -11.111 | -94.937 |
| 2021-03-01 | 0.07 | -12.5 | -89.231 |
| 2021-04-01 | 0.07 | 0 | 40 |
| 2021-05-01 | 0.06 | -14.286 | 20 |
| 2021-06-01 | 0.08 | 33.333 | 0 |
| 2021-07-01 | 0.1 | 25 | 11.111 |
| 2021-08-01 | 0.09 | -10 | -10 |
| 2021-09-01 | 0.08 | -11.111 | -11.111 |
| 2021-10-01 | 0.08 | 0 | -11.111 |
| 2021-11-01 | 0.08 | 0 | -11.111 |
| 2021-12-01 | 0.08 | 0 | -11.111 |
| 2022-01-01 | 0.08 | 0 | -11.111 |
| Date | fedfunds | Max_min | Date | fedfunds_mom | Max_min | Date | fedfunds_yoy | Max_min |
|---|---|---|---|---|---|---|---|---|
| 1981-06-01 | 19.1 | Max | 2015-12-01 | 100 | Max | 2016-02-01 | 245.45 | Max |
| 2020-04-01 | 0.05 | min | 2020-04-01 | -92.31 | min | 2020-04-01 | -97.93 | min |
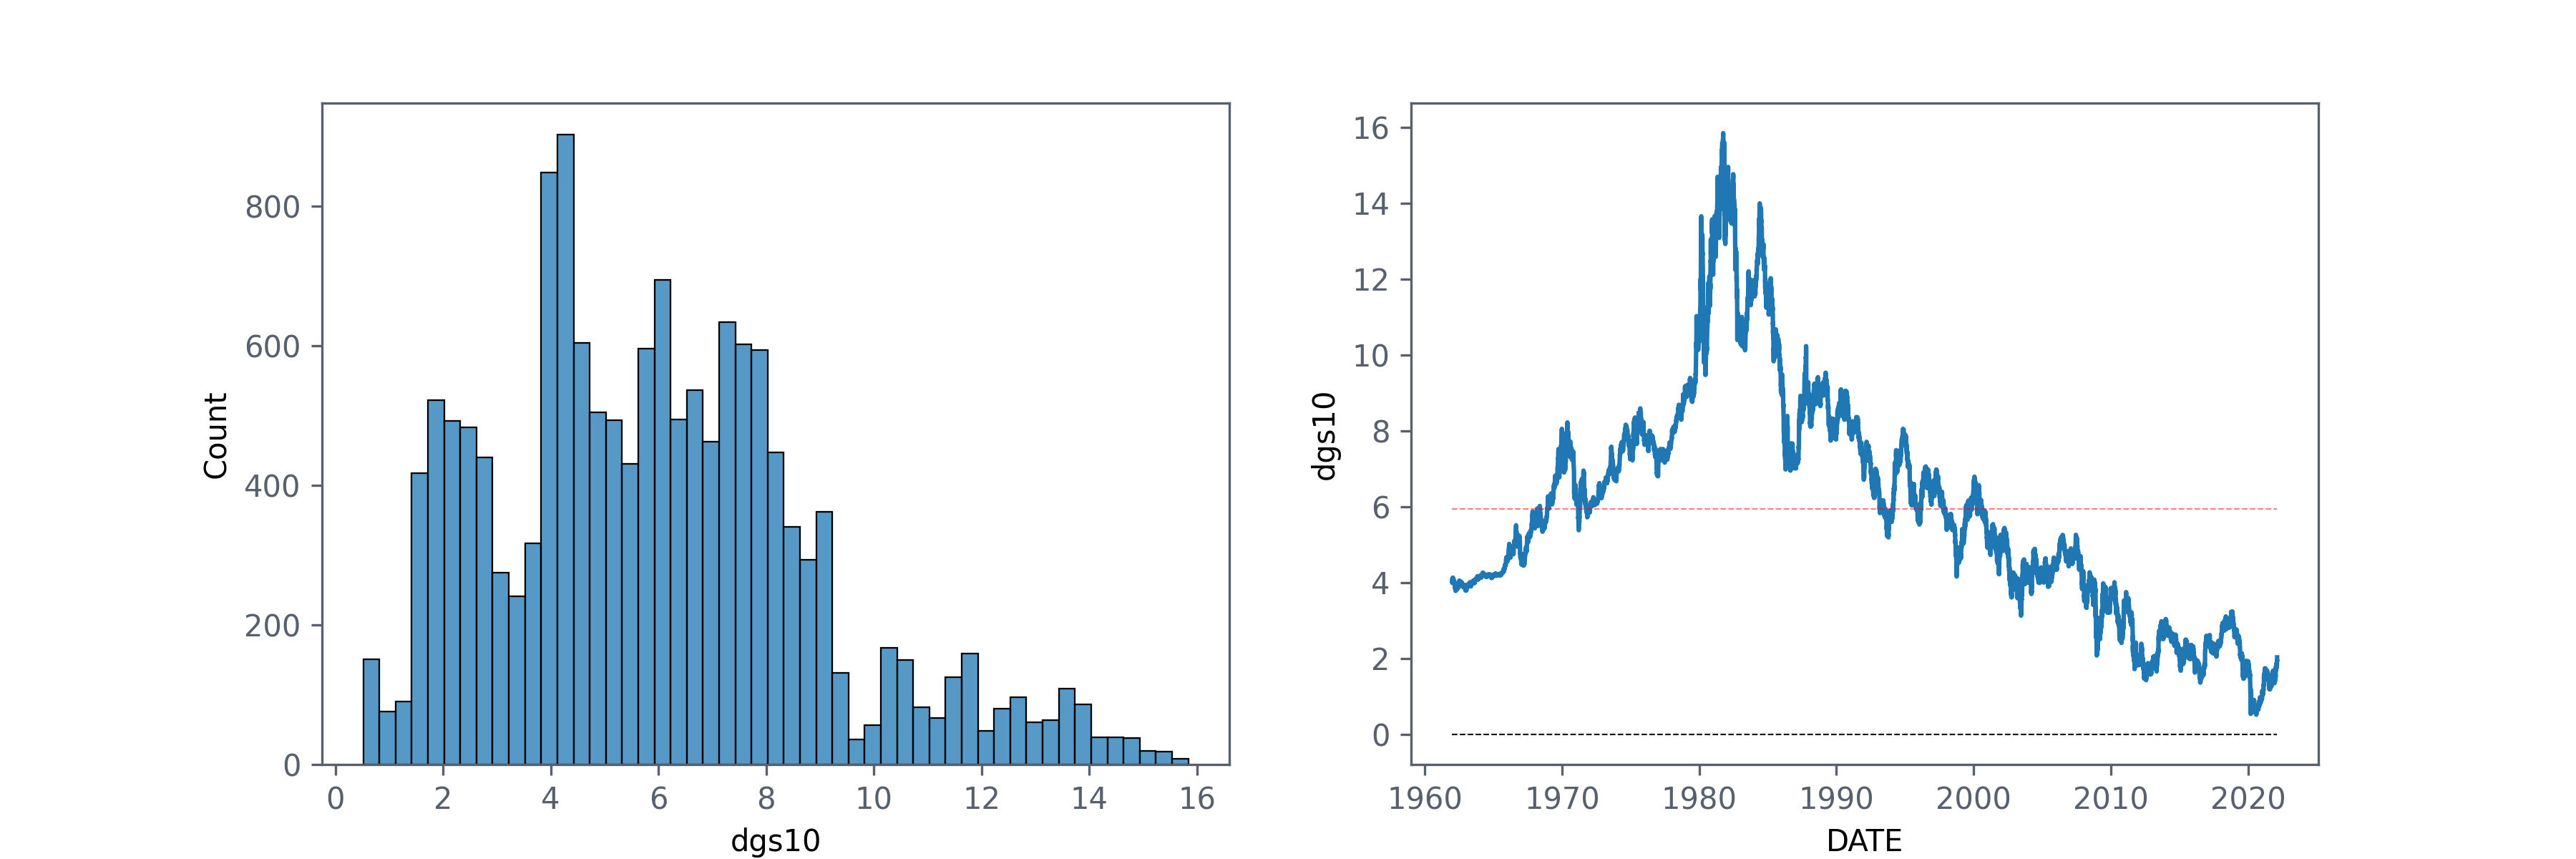
10-year treasury note yield
MEV = ‘DGS10’ NAME = ‘dgs10’
T10 Year over Year
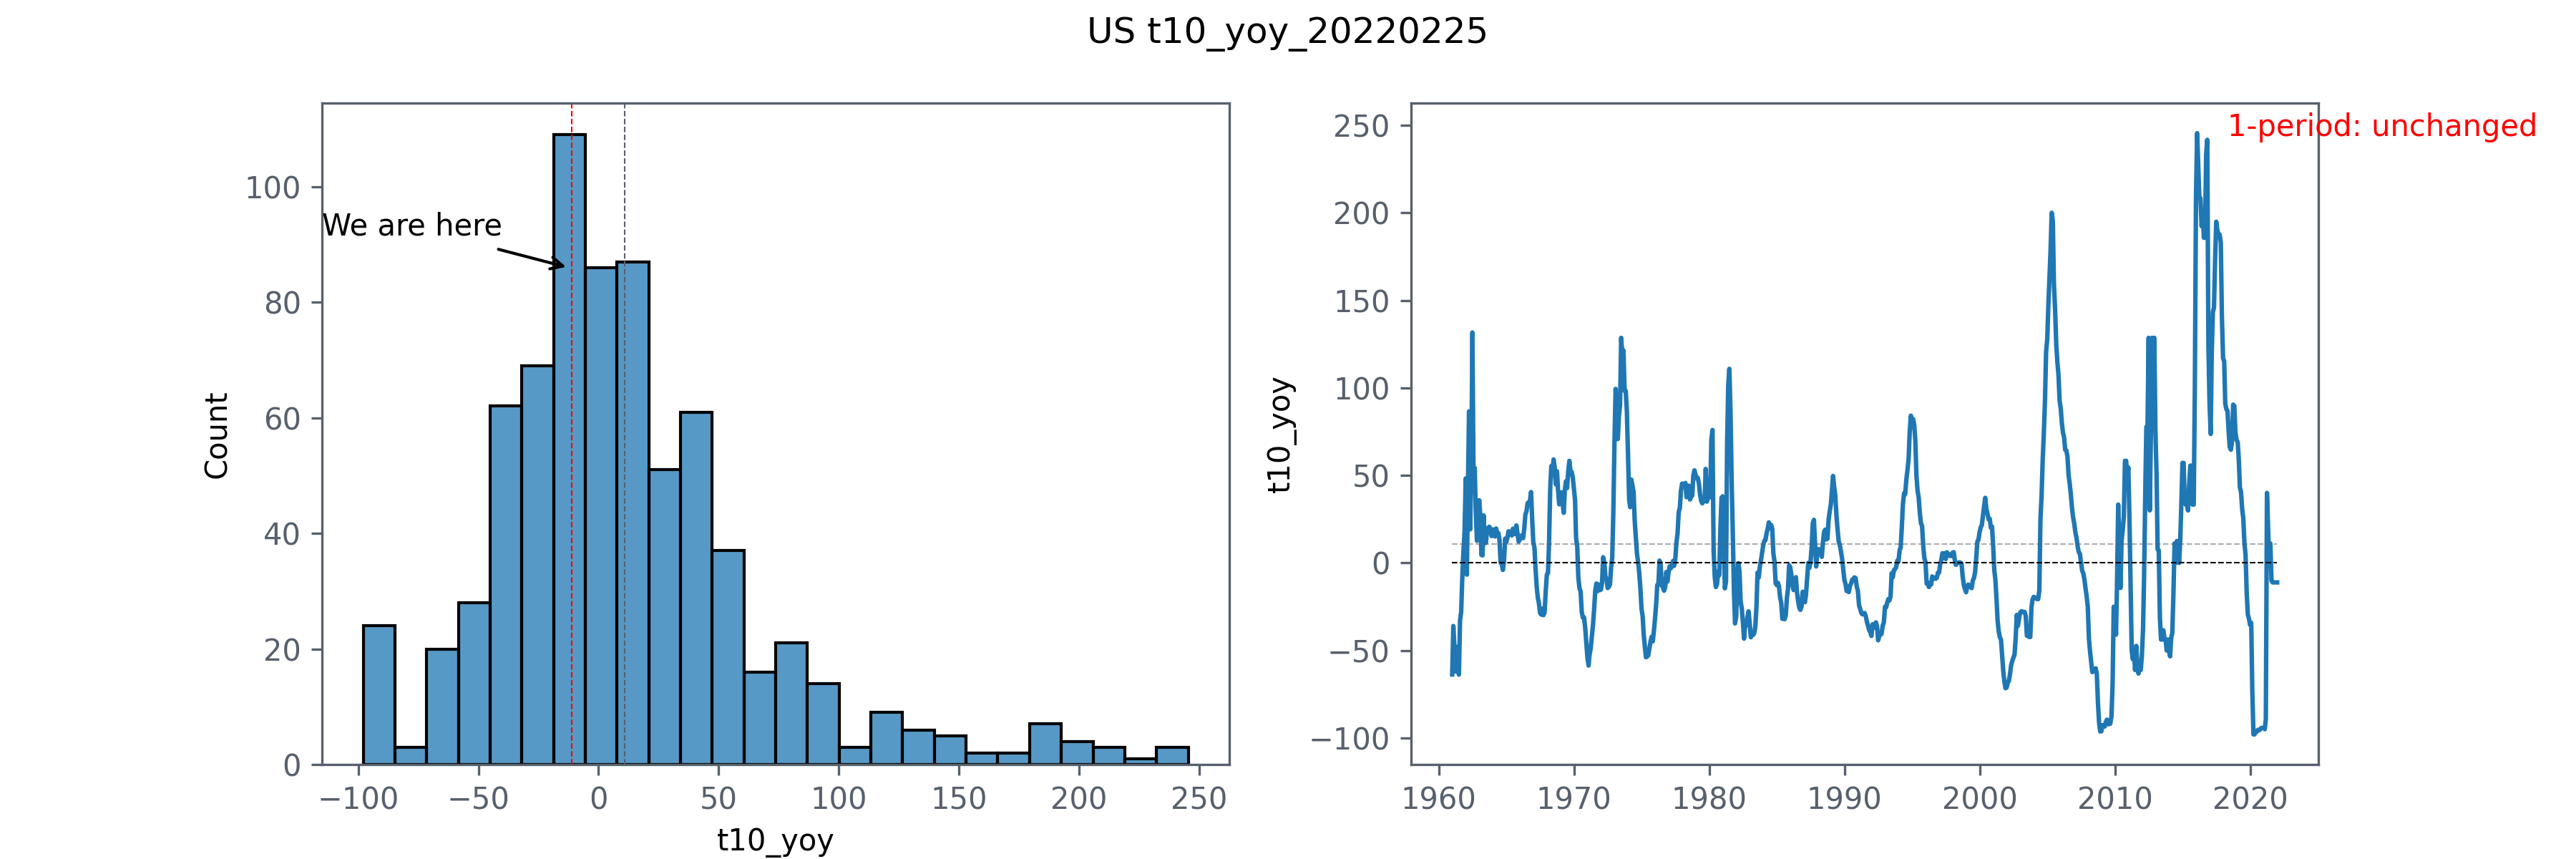
T10 Month over Month

| Date | t10 | Max_min | Date | t10_mom | Max_min | Date | t10_yoy | Max_min |
|---|---|---|---|---|---|---|---|---|
| 1981-06-01 | 19.1 | Max | 2015-12-01 | 100 | Max | 2016-02-01 | 245.45 | Max |
| 2020-04-01 | 0.05 | min | 2020-04-01 | -92.31 | min | 2020-04-01 | -97.93 | min |
| t10 | t10_mom | t10_yoy | |
|---|---|---|---|
| 2021-01-01 00:00:00 | 0.1 | 0 | -94.2 |
| 2021-02-01 00:00:00 | 0.1 | -11.1 | -94.9 |
| 2021-03-01 00:00:00 | 0.1 | -12.5 | -89.2 |
| 2021-04-01 00:00:00 | 0.1 | 0 | 40 |
| 2021-05-01 00:00:00 | 0.1 | -14.3 | 20 |
| 2021-06-01 00:00:00 | 0.1 | 33.3 | 0 |
| 2021-07-01 00:00:00 | 0.1 | 25 | 11.1 |
| 2021-08-01 00:00:00 | 0.1 | -10 | -10 |
| 2021-09-01 00:00:00 | 0.1 | -11.1 | -11.1 |
| 2021-10-01 00:00:00 | 0.1 | 0 | -11.1 |
| 2021-11-01 00:00:00 | 0.1 | 0 | -11.1 |
| 2021-12-01 00:00:00 | 0.1 | 0 | -11.1 |
| 2022-01-01 00:00:00 | 0.1 | 0 | -11.1 |
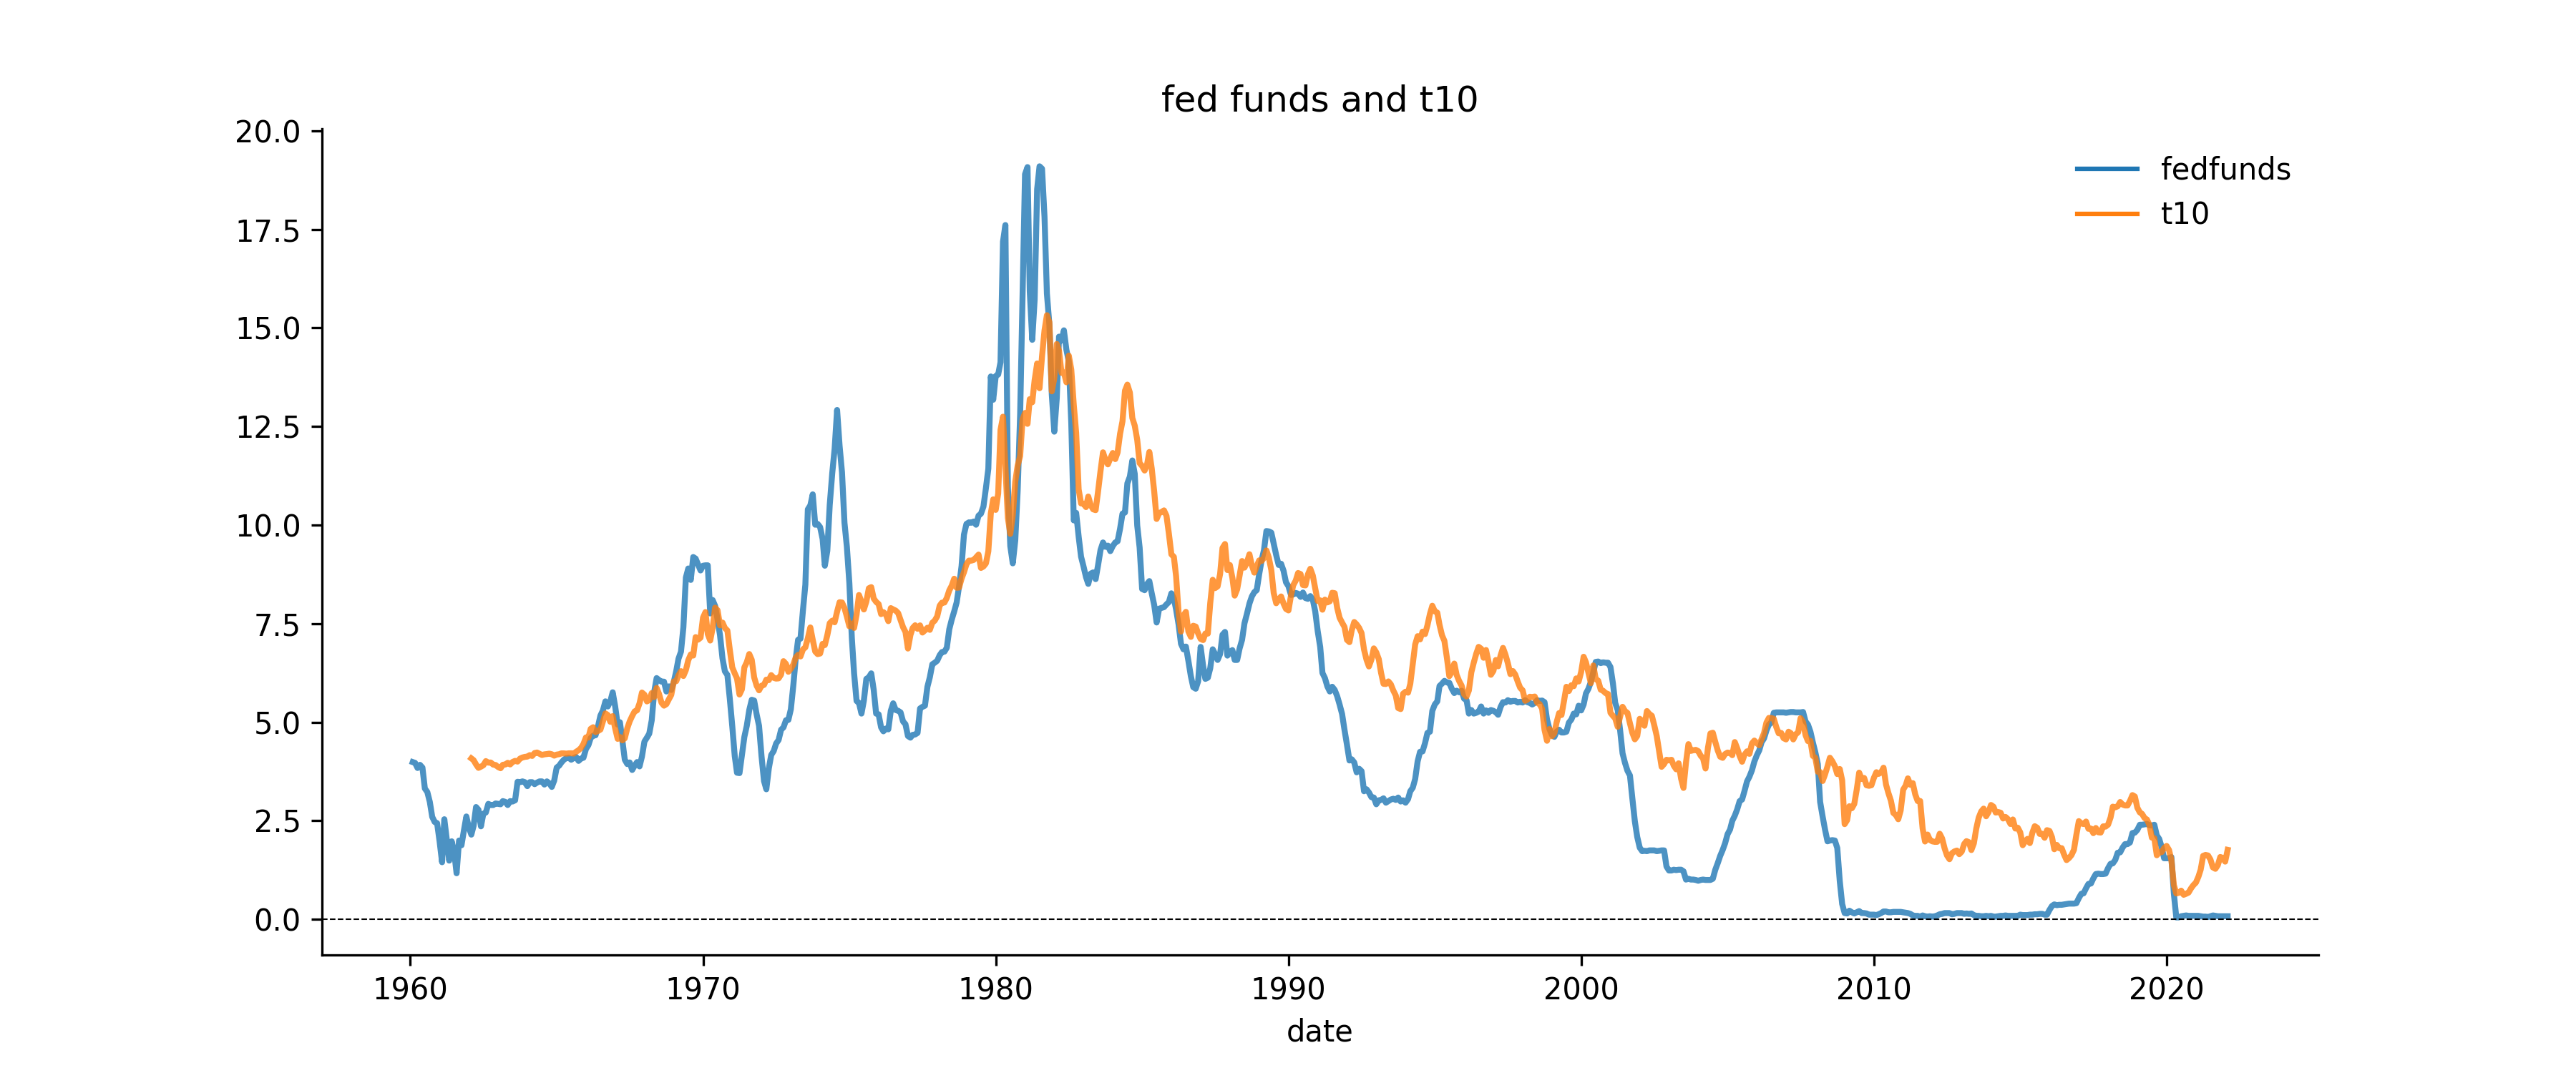
The fed funds rate and t10 are very much moving together. But the fed funds rate movement are much bigger than t10.
3-month treasury bill yield
MEV = ‘TB3MS’
NAME = ‘tb3ms’
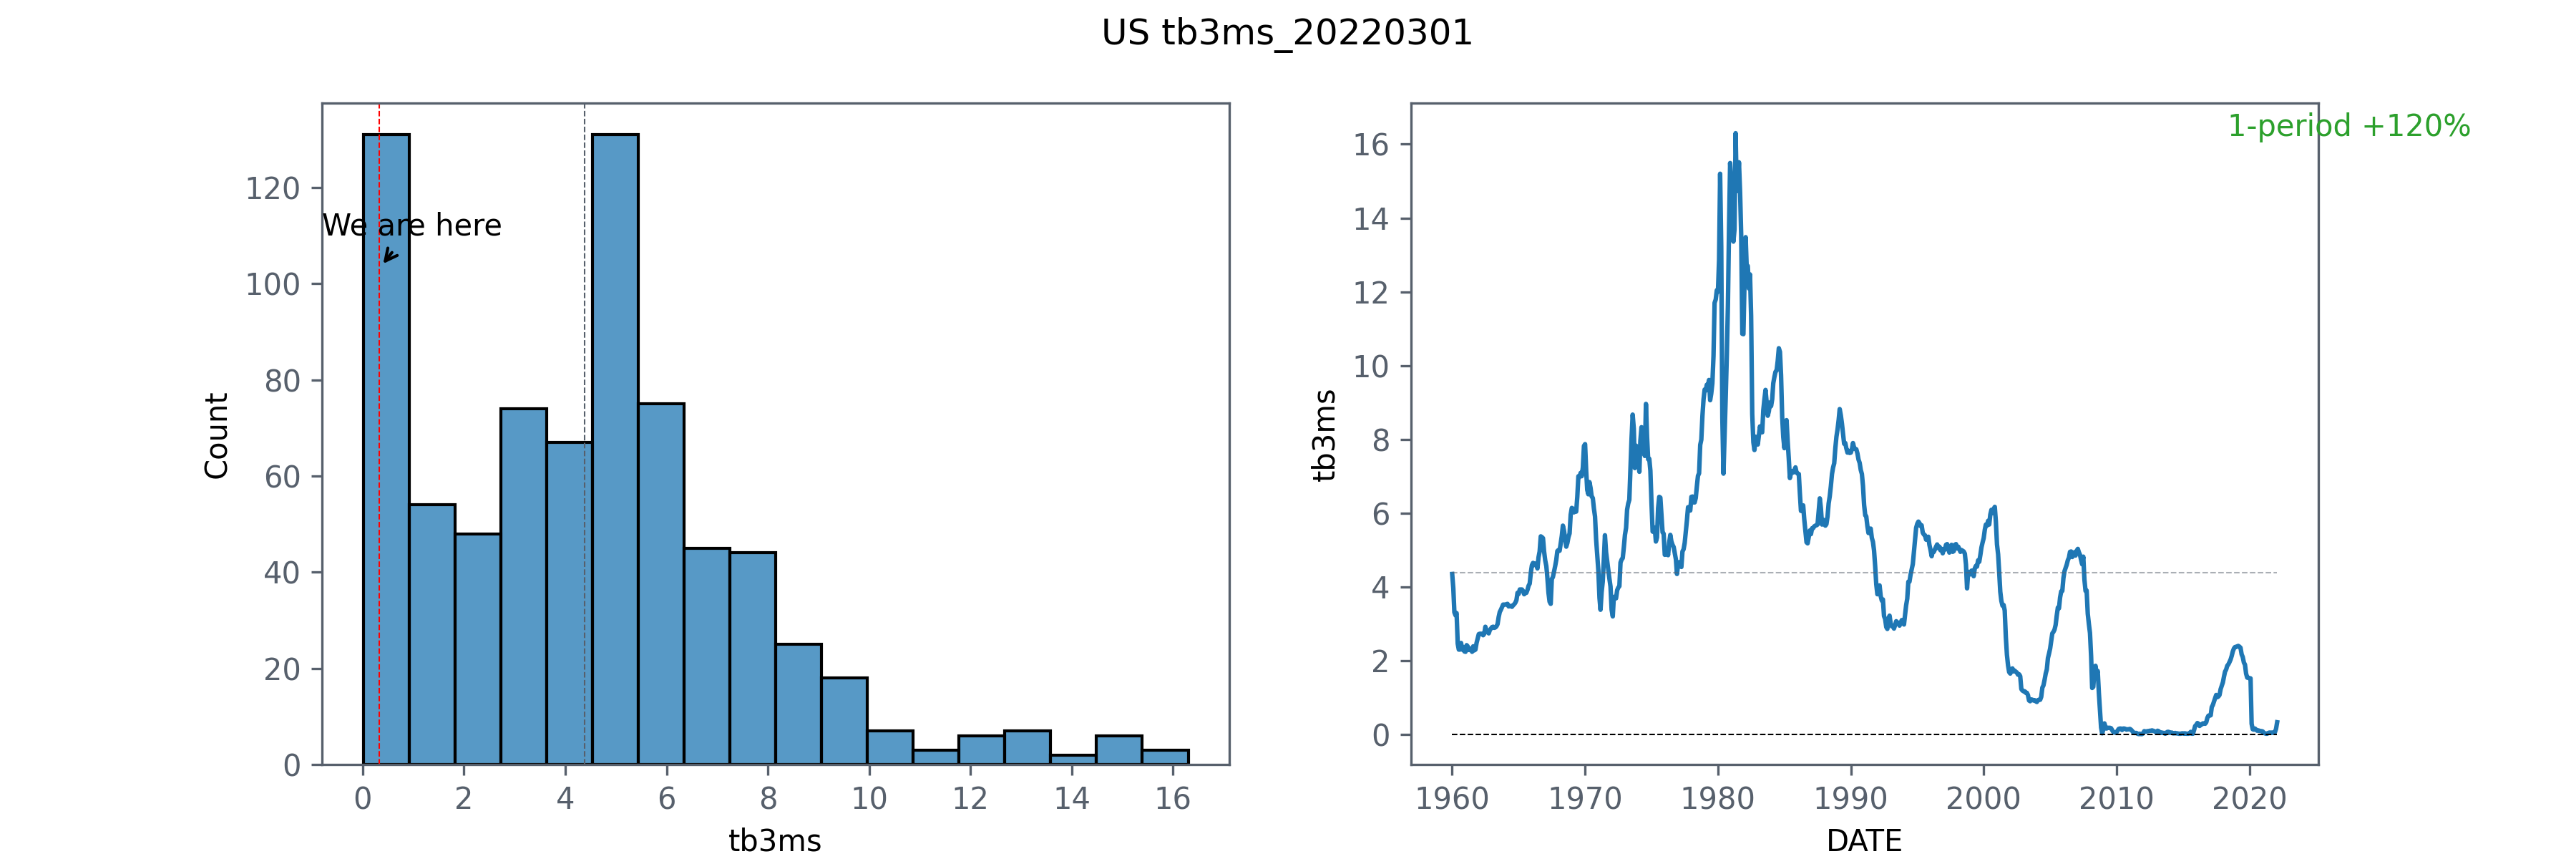
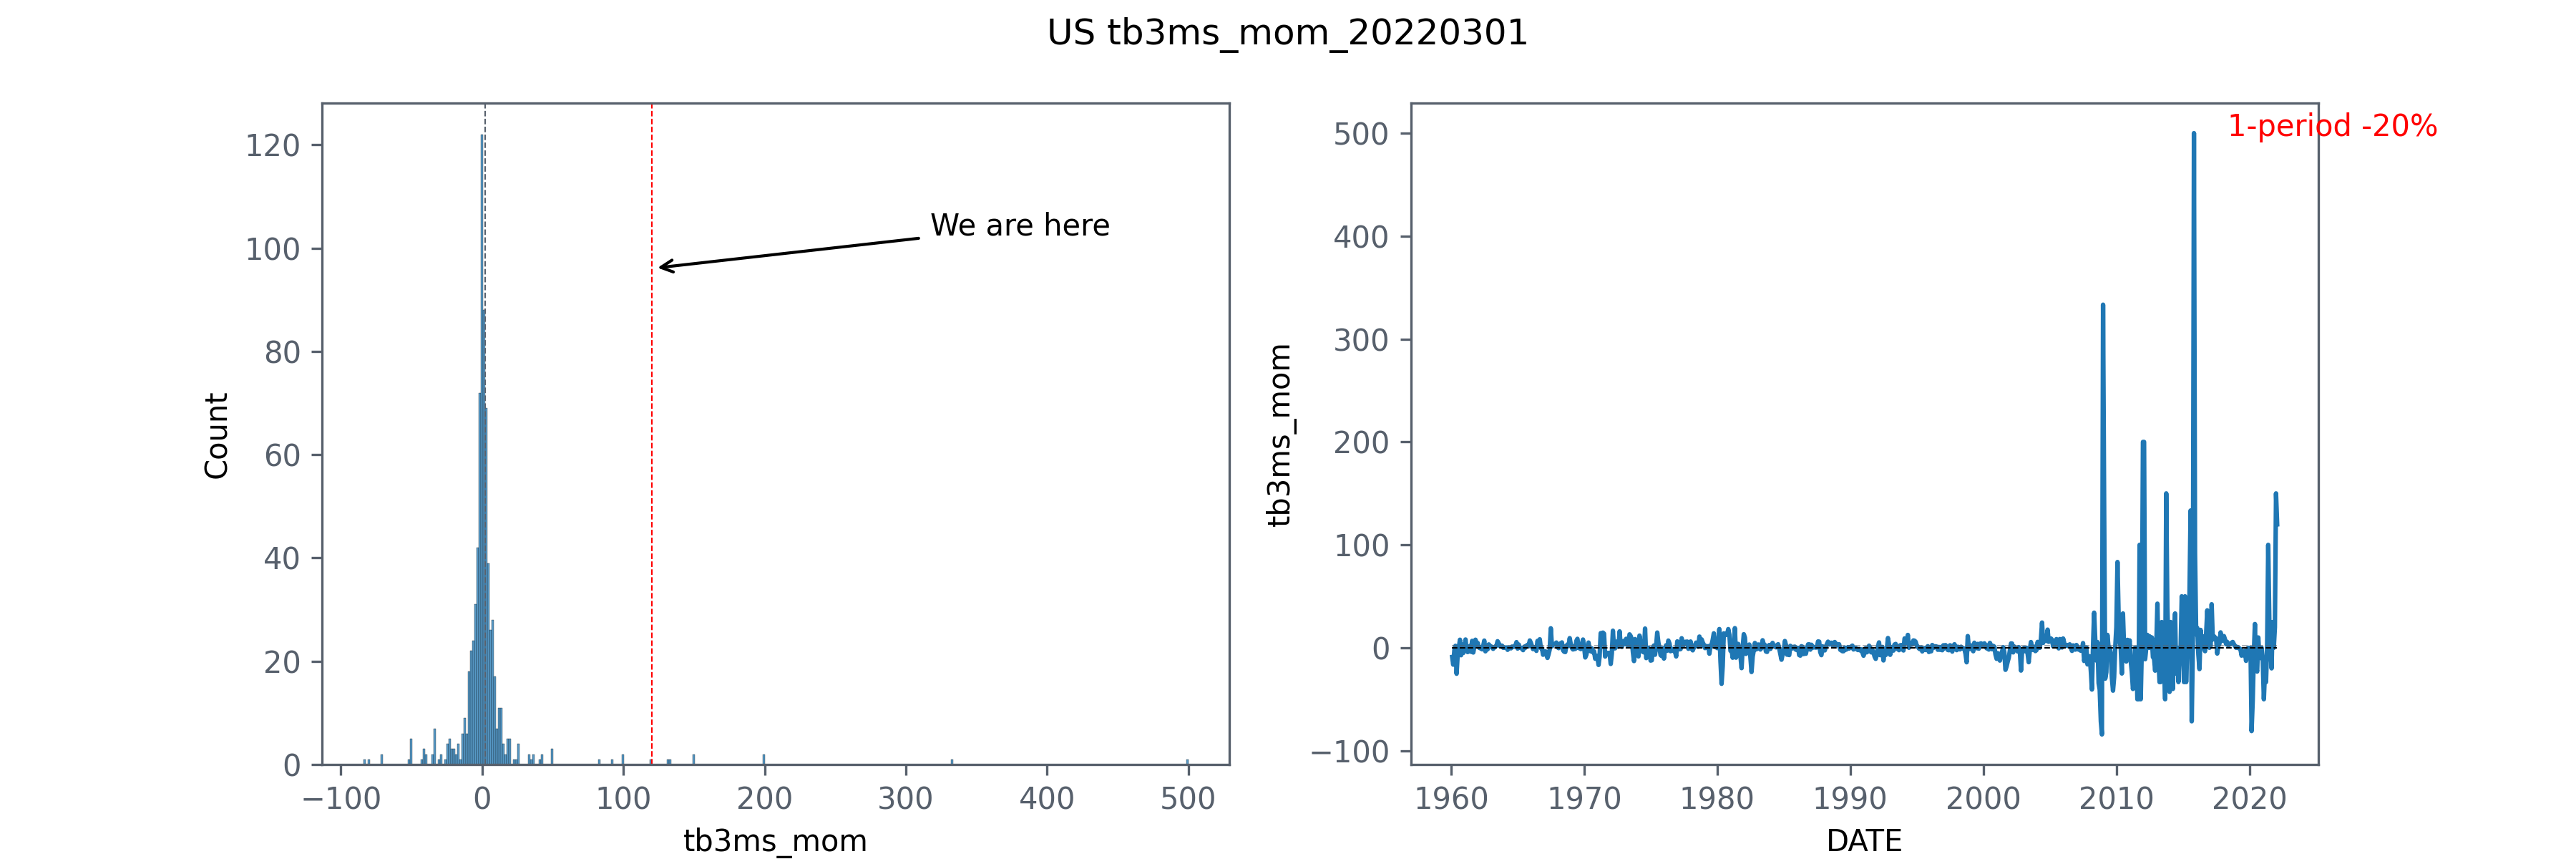
When looking at the YoY and Mom charts, don’t be overly alarmed by the seemingly astronomically large rates of change. The cause is that the denominators are very small.
3m Treasury Month over Month
3m Treasury Year over Year

Similar to other rates, the maximum rates are in early 1981.
Besides the magnitude of rates themselves, we should also pay close attention to large rate changes and understand the reasons behind them.
Note the rates have been zero or near zero in 2021. Rates have been increasing in 2022 slowly.
| Date | tb3ms | Max_min | Date | tb3ms_mom | Max_min | Date | tb3ms_yoy | Max_min |
|---|---|---|---|---|---|---|---|---|
| 1981-05-01 | 16.3 | Max | 2015-11-01 | 500 | Max | 2016-10-01 | 1550 | Max |
| 2011-09-01 | 0.01 | min | 2008-12-01 | -84.21 | min | 2008-12-01 | -99 | min |
Recent 3m Treasury
| DATE | tb3ms | tb3ms_mom | tb3ms_yoy |
|---|---|---|---|
| 2021-02-01 | 0 | -50 | -97.4 |
| 2021-03-01 | 0 | -25 | -89.7 |
| 2021-04-01 | 0 | -33.3 | -85.7 |
| 2021-05-01 | 0 | 0 | -84.6 |
| 2021-06-01 | 0 | 100 | -75 |
| 2021-07-01 | 0 | 25 | -61.5 |
| 2021-08-01 | 0 | 0 | -50 |
| 2021-09-01 | 0 | -20 | -63.6 |
| 2021-10-01 | 0 | 25 | -50 |
| 2021-11-01 | 0 | 0 | -44.4 |
| 2021-12-01 | 0.1 | 20 | -33.3 |
| 2022-01-01 | 0.2 | 150 | 87.5 |
| 2022-02-01 | 0.3 | 120 | 725 |
High rate period of 3m Treasury
| DATE | tb3ms | tb3ms_mom | tb3ms_yoy |
|---|---|---|---|
| 1979-06-01 | 9.06 | -5.72 | 34.62 |
| 1979-07-01 | 9.24 | 1.99 | 31.81 |
| 1979-08-01 | 9.52 | 3.03 | 34.46 |
| 1979-09-01 | 10.26 | 7.77 | 30.7 |
| 1979-10-01 | 11.7 | 14.04 | 46.43 |
| 1979-11-01 | 11.79 | 0.77 | 36.46 |
| 1979-12-01 | 12.04 | 2.12 | 32.6 |
| 1980-01-01 | 12 | -0.33 | 28.34 |
| 1980-02-01 | 12.86 | 7.17 | 37.98 |
| 1980-03-01 | 15.2 | 18.2 | 60.34 |
| 1980-04-01 | 13.2 | -13.16 | 39.53 |
| 1980-05-01 | 8.58 | -35 | -10.72 |
| 1980-06-01 | 7.07 | -17.6 | -21.96 |
| 1980-07-01 | 8.06 | 14 | -12.77 |
| 1980-08-01 | 9.13 | 13.28 | -4.1 |
| 1980-09-01 | 10.27 | 12.49 | 0.1 |
| 1980-10-01 | 11.62 | 13.15 | -0.68 |
| 1980-11-01 | 13.73 | 18.16 | 16.45 |
| 1980-12-01 | 15.49 | 12.82 | 28.65 |
| 1981-01-01 | 15.02 | -3.03 | 25.17 |
| 1981-02-01 | 14.79 | -1.53 | 15.01 |
| 1981-03-01 | 13.36 | -9.67 | -12.11 |
| 1981-04-01 | 13.69 | 2.47 | 3.71 |
| 1981-05-01 | 16.3 | 19.07 | 89.98 |
| 1981-06-01 | 14.73 | -9.63 | 108.35 |
4. Economy
Unemployment rate
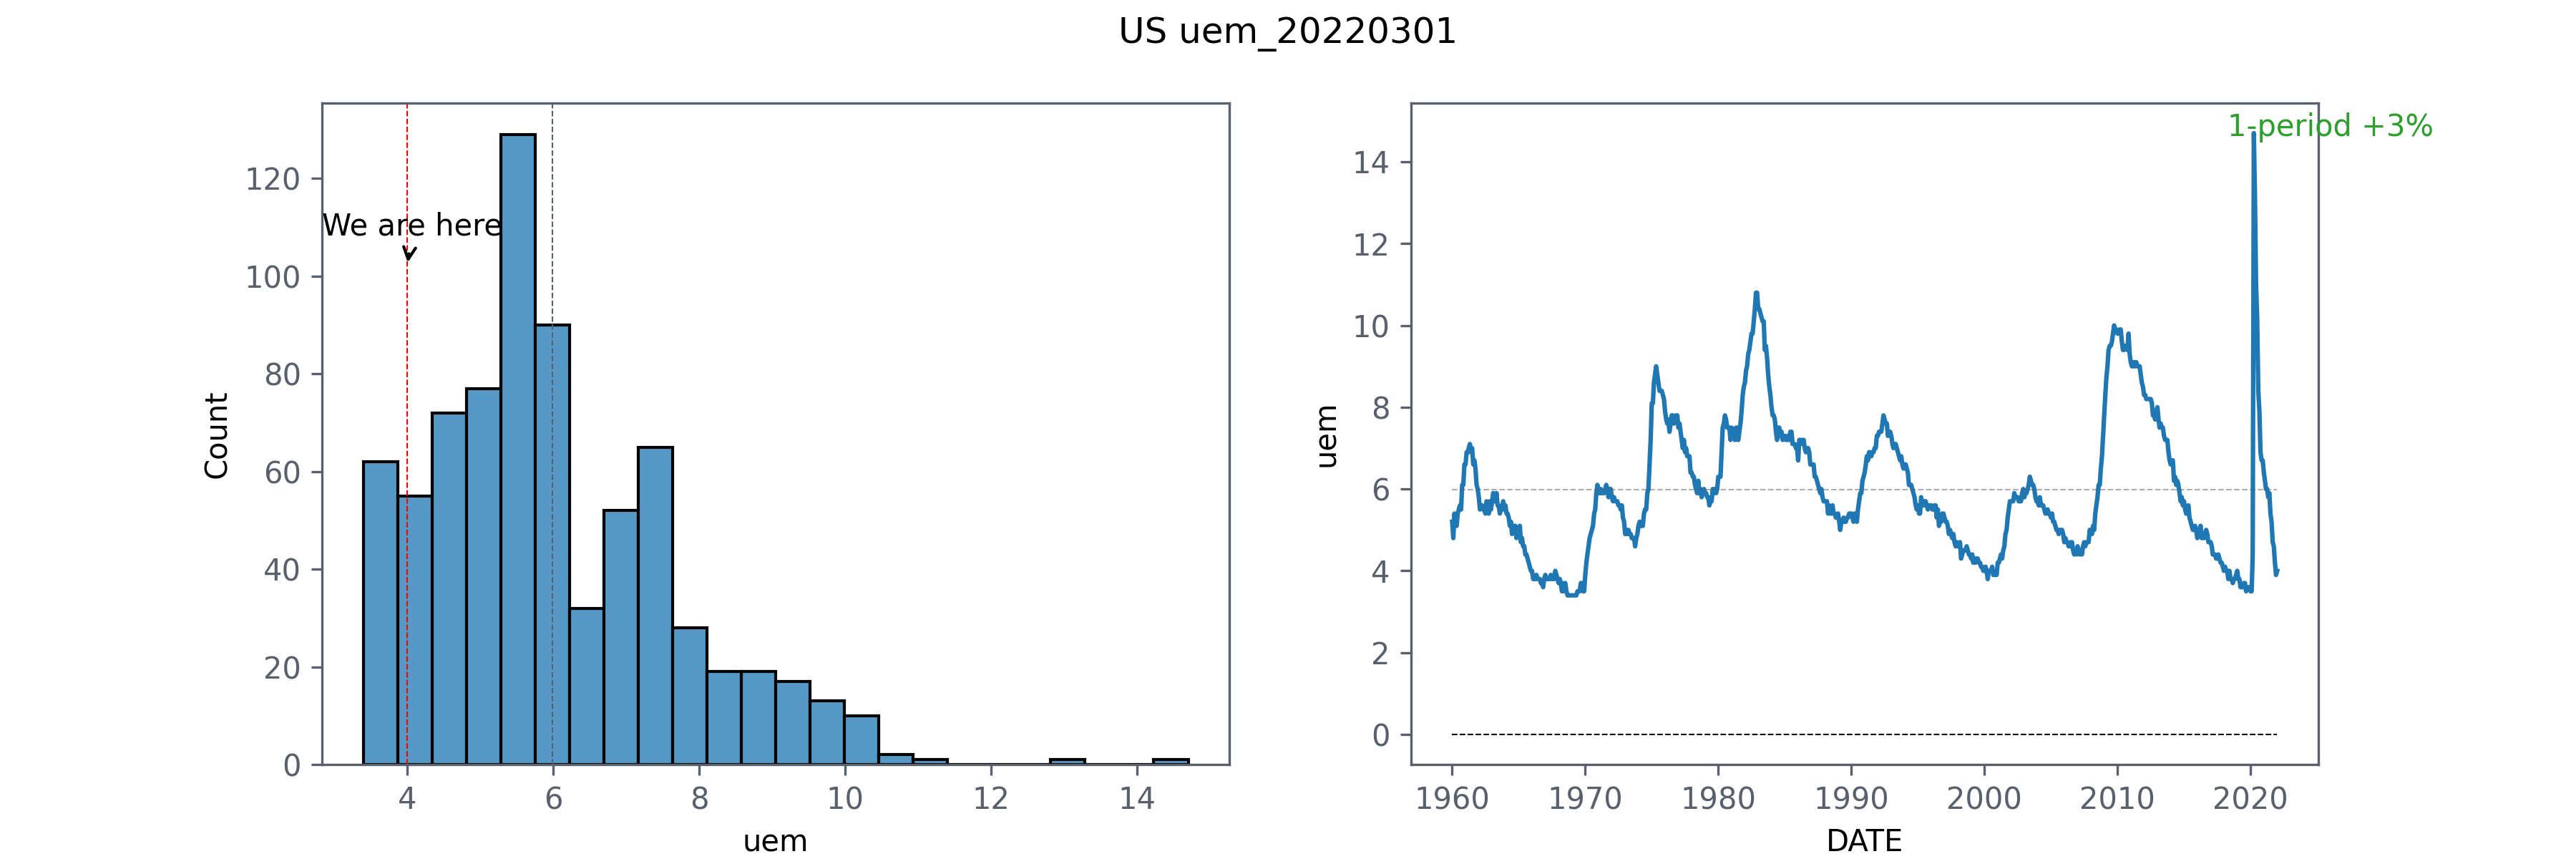
Unemployment Rate Month over Month
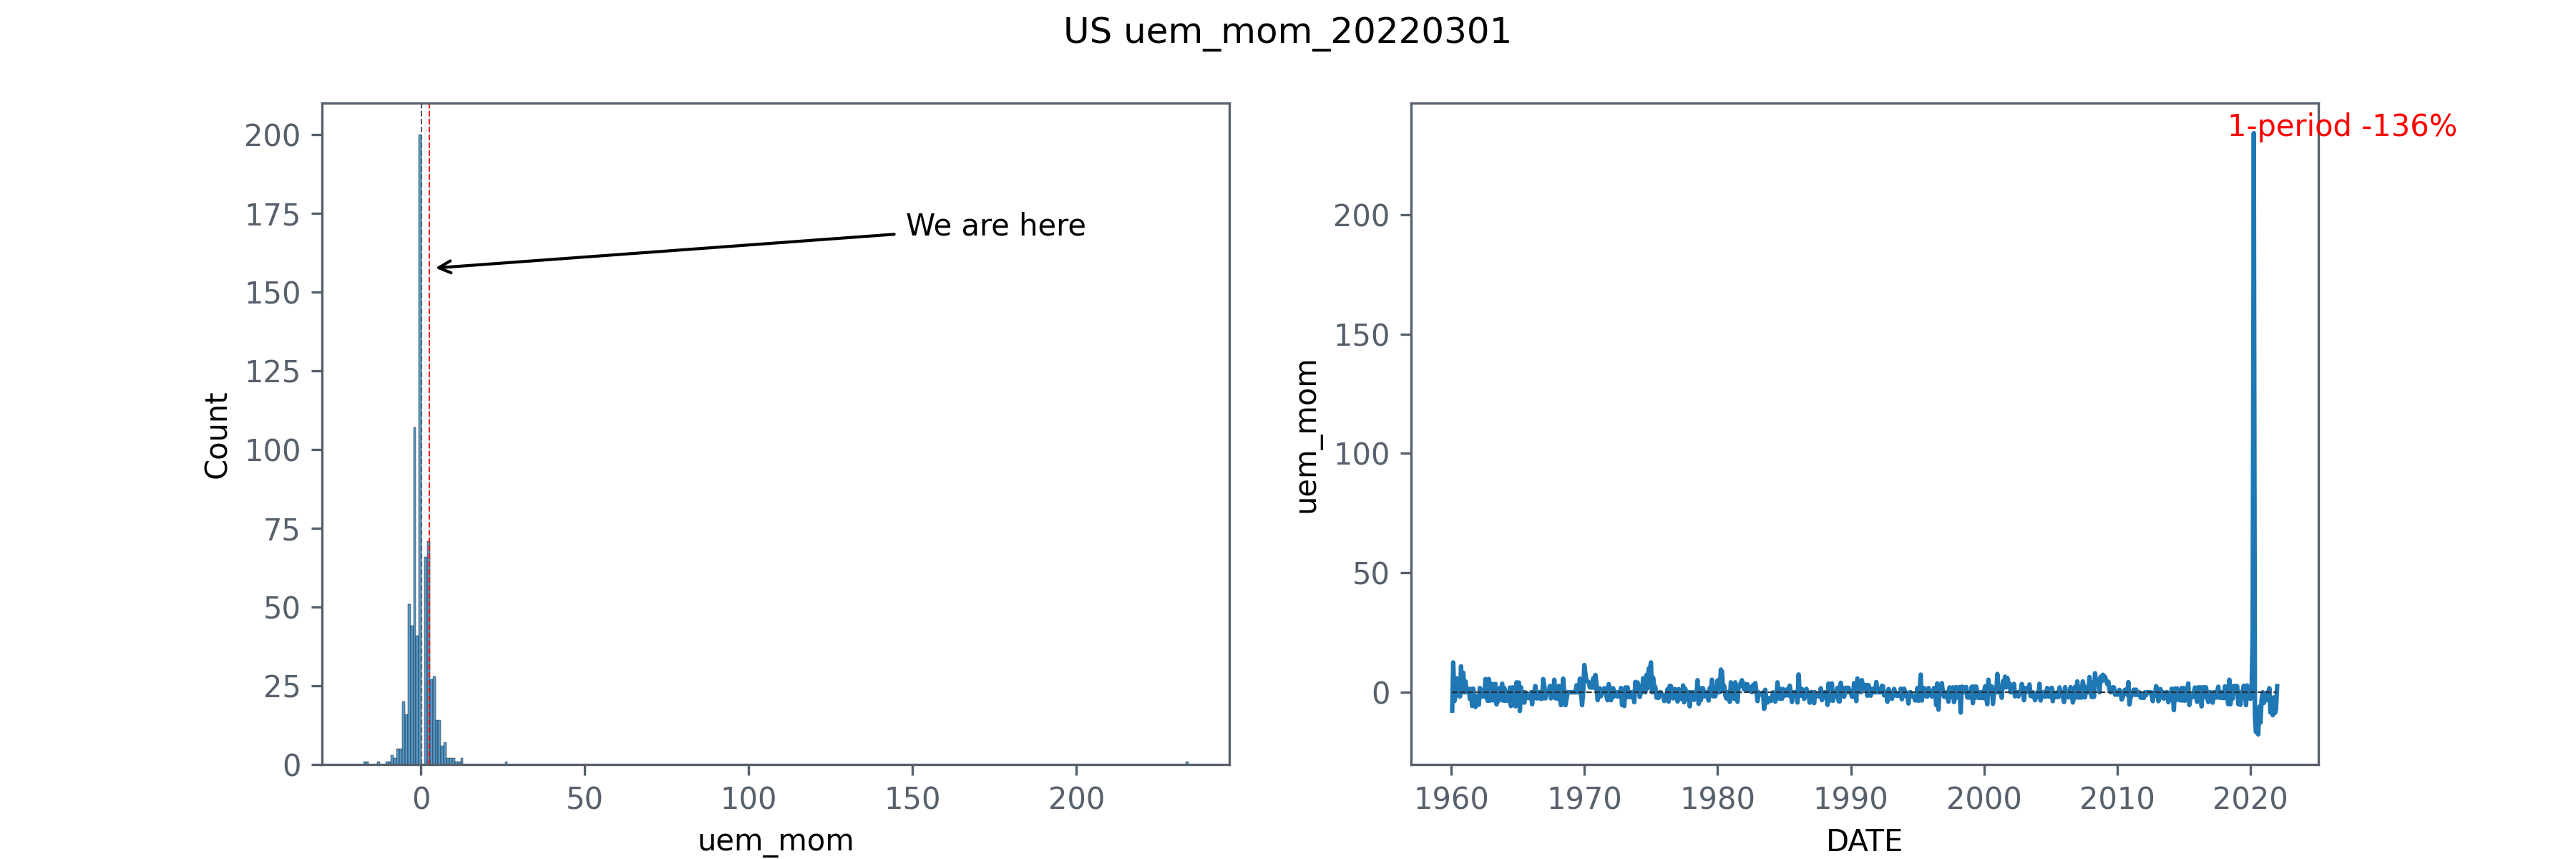
Unemployment Rate Year over Year
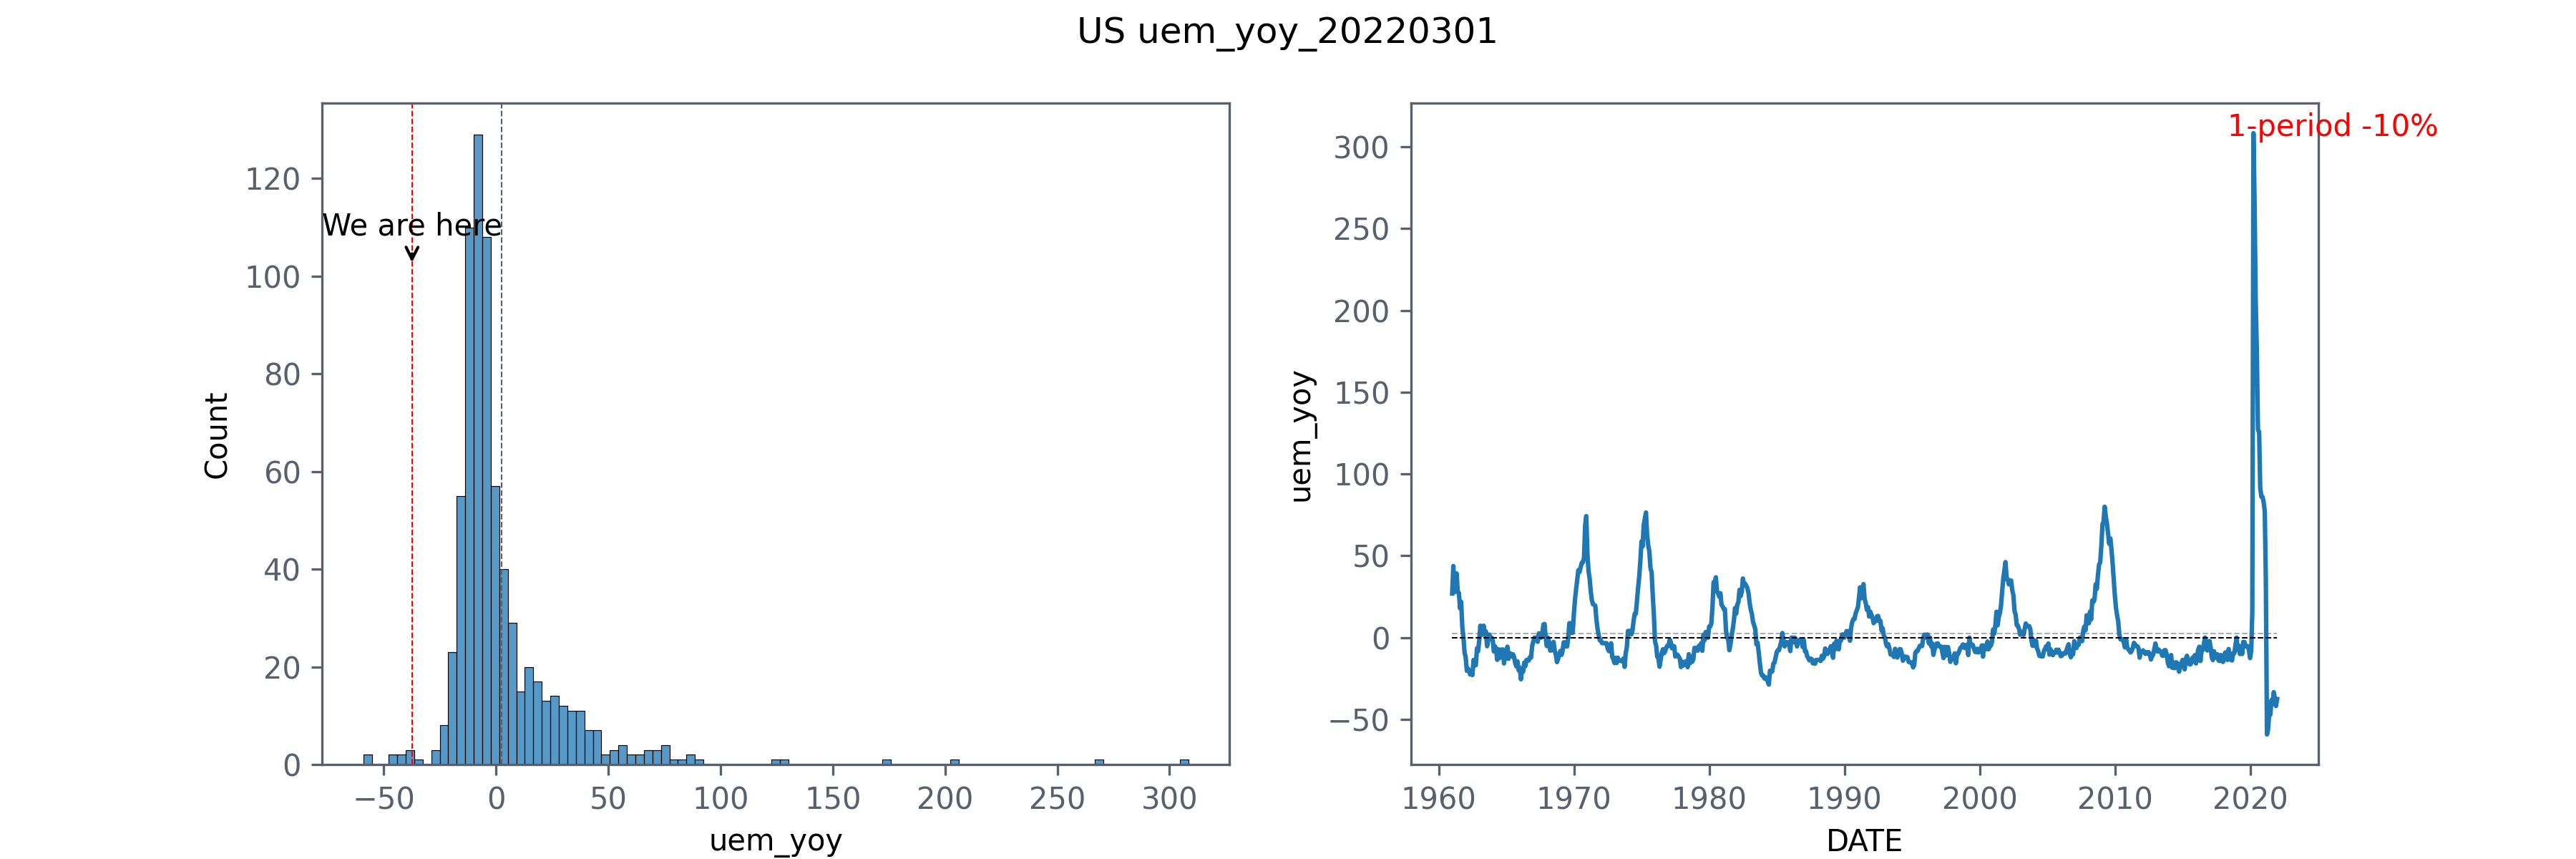
Unemployment Rate Extreme Values
| Date | uem | Max_min | Date | uem_mom | Max_min | Date | uem_yoy | Max_min |
|---|---|---|---|---|---|---|---|---|
| 2020-04-01 | 14.7 | Max | 2020-04-01 | 234.09 | Max | 2020-04-01 | 308.33 | Max |
| 1968-09-01 | 3.4 | min | 2020-08-01 | -17.65 | min | 2021-04-01 | -59.18 | min |
Recent Unemployment Rate
| DATE | uem | uem_mom | uem_yoy |
|---|---|---|---|
| 2021-01-01 | 6.4 | -4.5 | 82.9 |
| 2021-02-01 | 6.2 | -3.1 | 77.1 |
| 2021-03-01 | 6 | -3.2 | 36.4 |
| 2021-04-01 | 6 | 0 | -59.2 |
| 2021-05-01 | 5.8 | -3.3 | -56.1 |
| 2021-06-01 | 5.9 | 1.7 | -46.4 |
| 2021-07-01 | 5.4 | -8.5 | -47.1 |
| 2021-08-01 | 5.2 | -3.7 | -38.1 |
| 2021-09-01 | 4.7 | -9.6 | -40.5 |
| 2021-10-01 | 4.6 | -2.1 | -33.3 |
| 2021-11-01 | 4.2 | -8.7 | -37.3 |
| 2021-12-01 | 3.9 | -7.1 | -41.8 |
| 2022-01-01 | 4 | 2.6 | -37.5 |
Unemployment Rate During High Rate Periods
| DATE | uem | uem_mom | uem_yoy |
|---|---|---|---|
| 1979-01-01 | 5.9 | -1.667 | -7.812 |
| 1979-02-01 | 5.9 | 0 | -6.349 |
| 1979-03-01 | 5.8 | -1.695 | -7.937 |
| 1979-04-01 | 5.8 | 0 | -4.918 |
| 1979-05-01 | 5.6 | -3.448 | -6.667 |
| 1979-06-01 | 5.7 | 1.786 | -3.39 |
| 1979-07-01 | 5.7 | 0 | -8.065 |
| 1979-08-01 | 6 | 5.263 | 1.695 |
| 1979-09-01 | 5.9 | -1.667 | -1.667 |
| 1979-10-01 | 6 | 1.695 | 3.448 |
| 1979-11-01 | 5.9 | -1.667 | 0 |
| 1979-12-01 | 6 | 1.695 | 0 |
| 1980-01-01 | 6.3 | 5 | 6.78 |
| 1980-02-01 | 6.3 | 0 | 6.78 |
| 1980-03-01 | 6.3 | 0 | 8.621 |
| 1980-04-01 | 6.9 | 9.524 | 18.966 |
| 1980-05-01 | 7.5 | 8.696 | 33.929 |
| 1980-06-01 | 7.6 | 1.333 | 33.333 |
| 1980-07-01 | 7.8 | 2.632 | 36.842 |
| 1980-08-01 | 7.7 | -1.282 | 28.333 |
| 1980-09-01 | 7.5 | -2.597 | 27.119 |
| 1980-10-01 | 7.5 | 0 | 25 |
| 1980-11-01 | 7.5 | 0 | 27.119 |
| 1980-12-01 | 7.2 | -4 | 20 |
| 1981-01-01 | 7.5 | 4.167 | 19.048 |
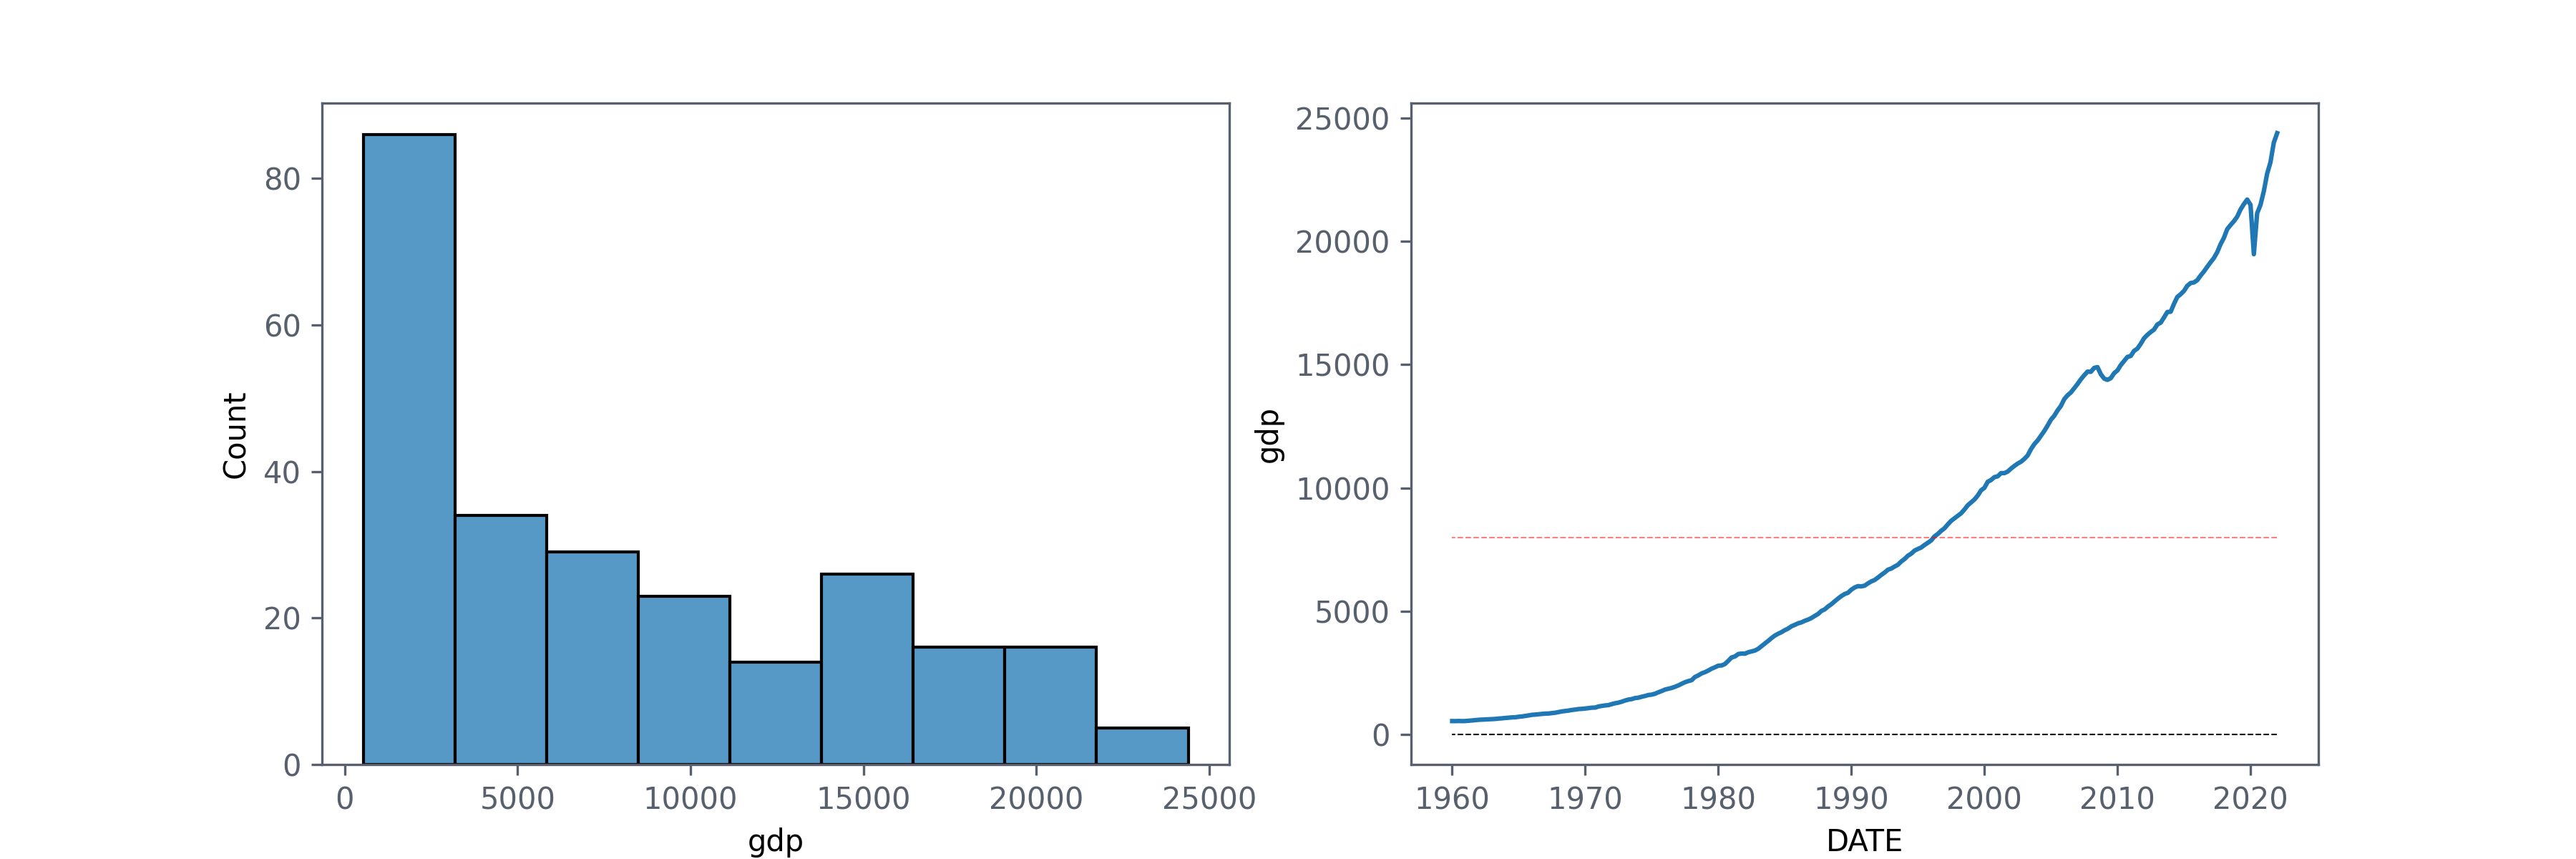
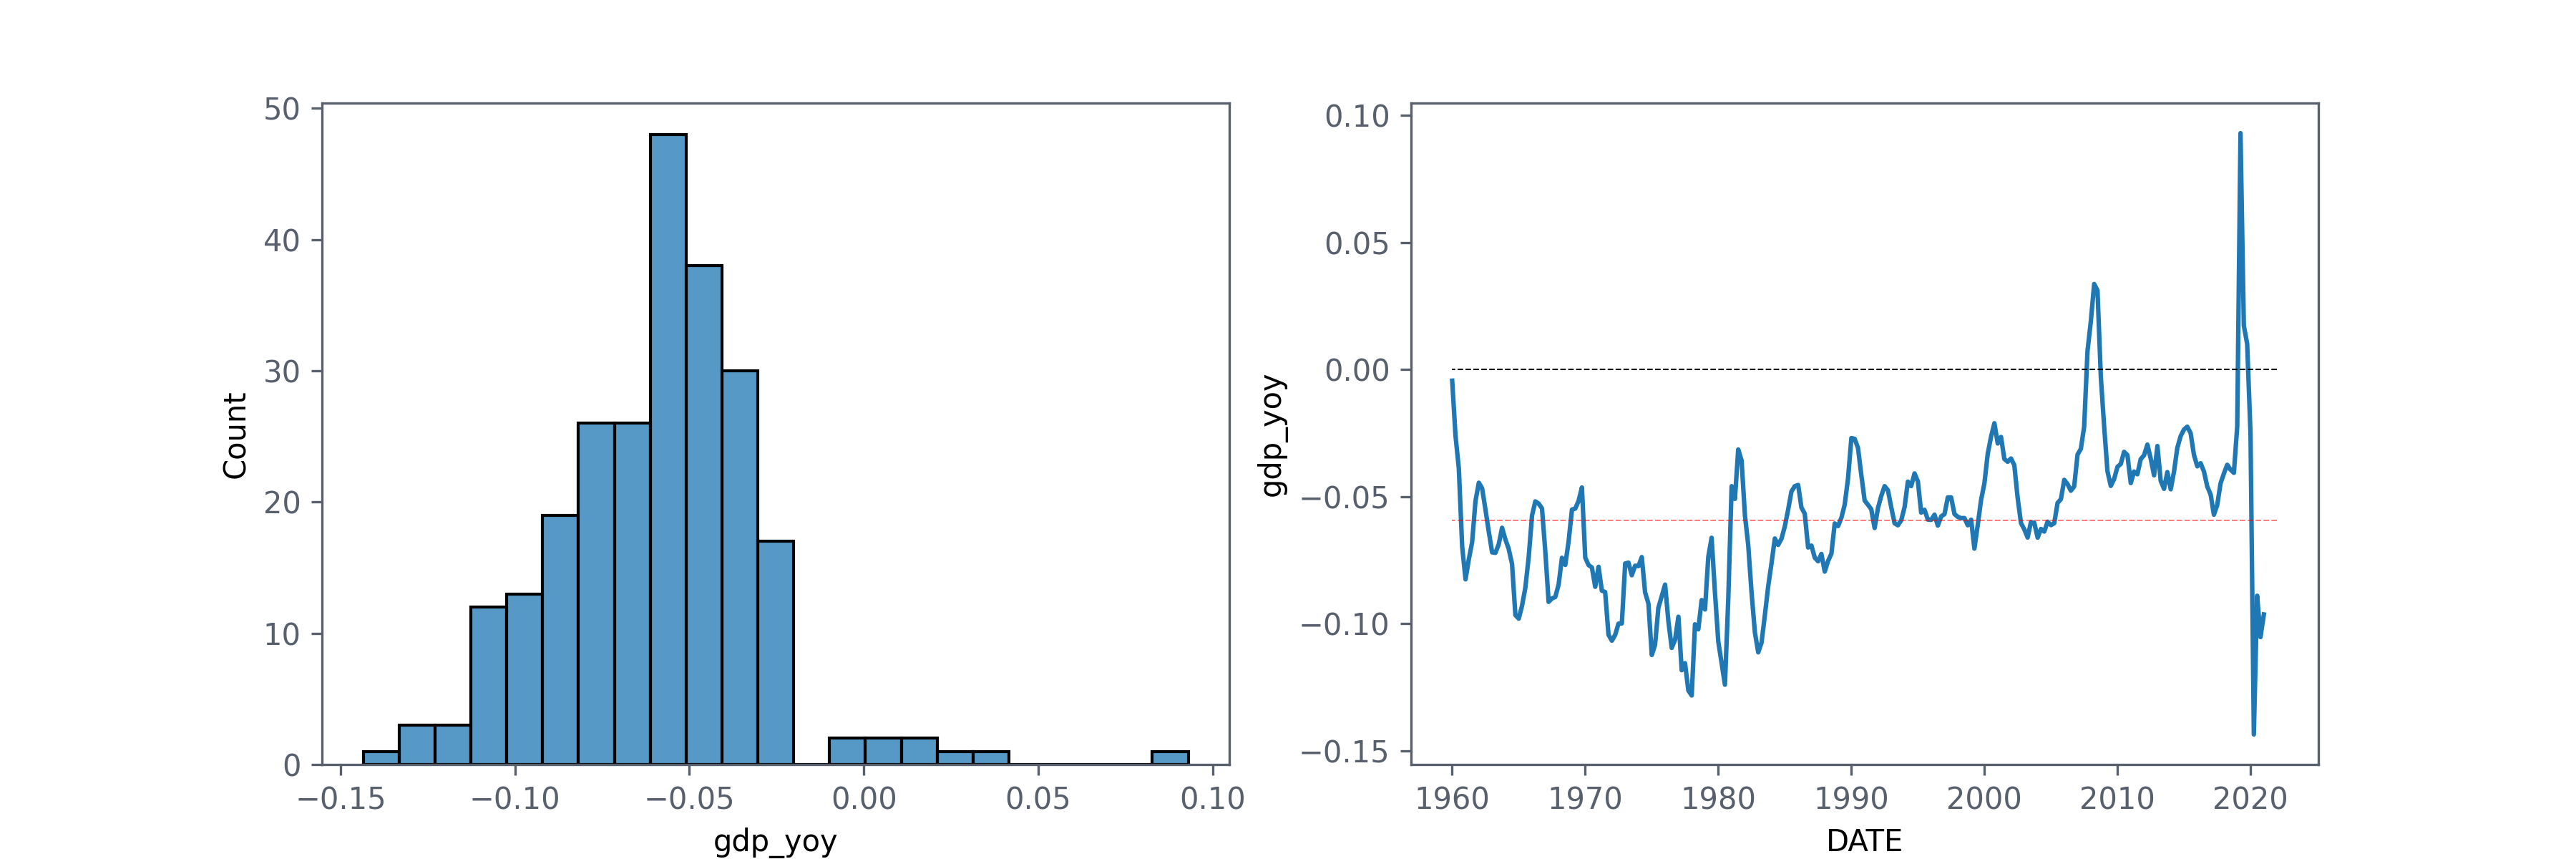
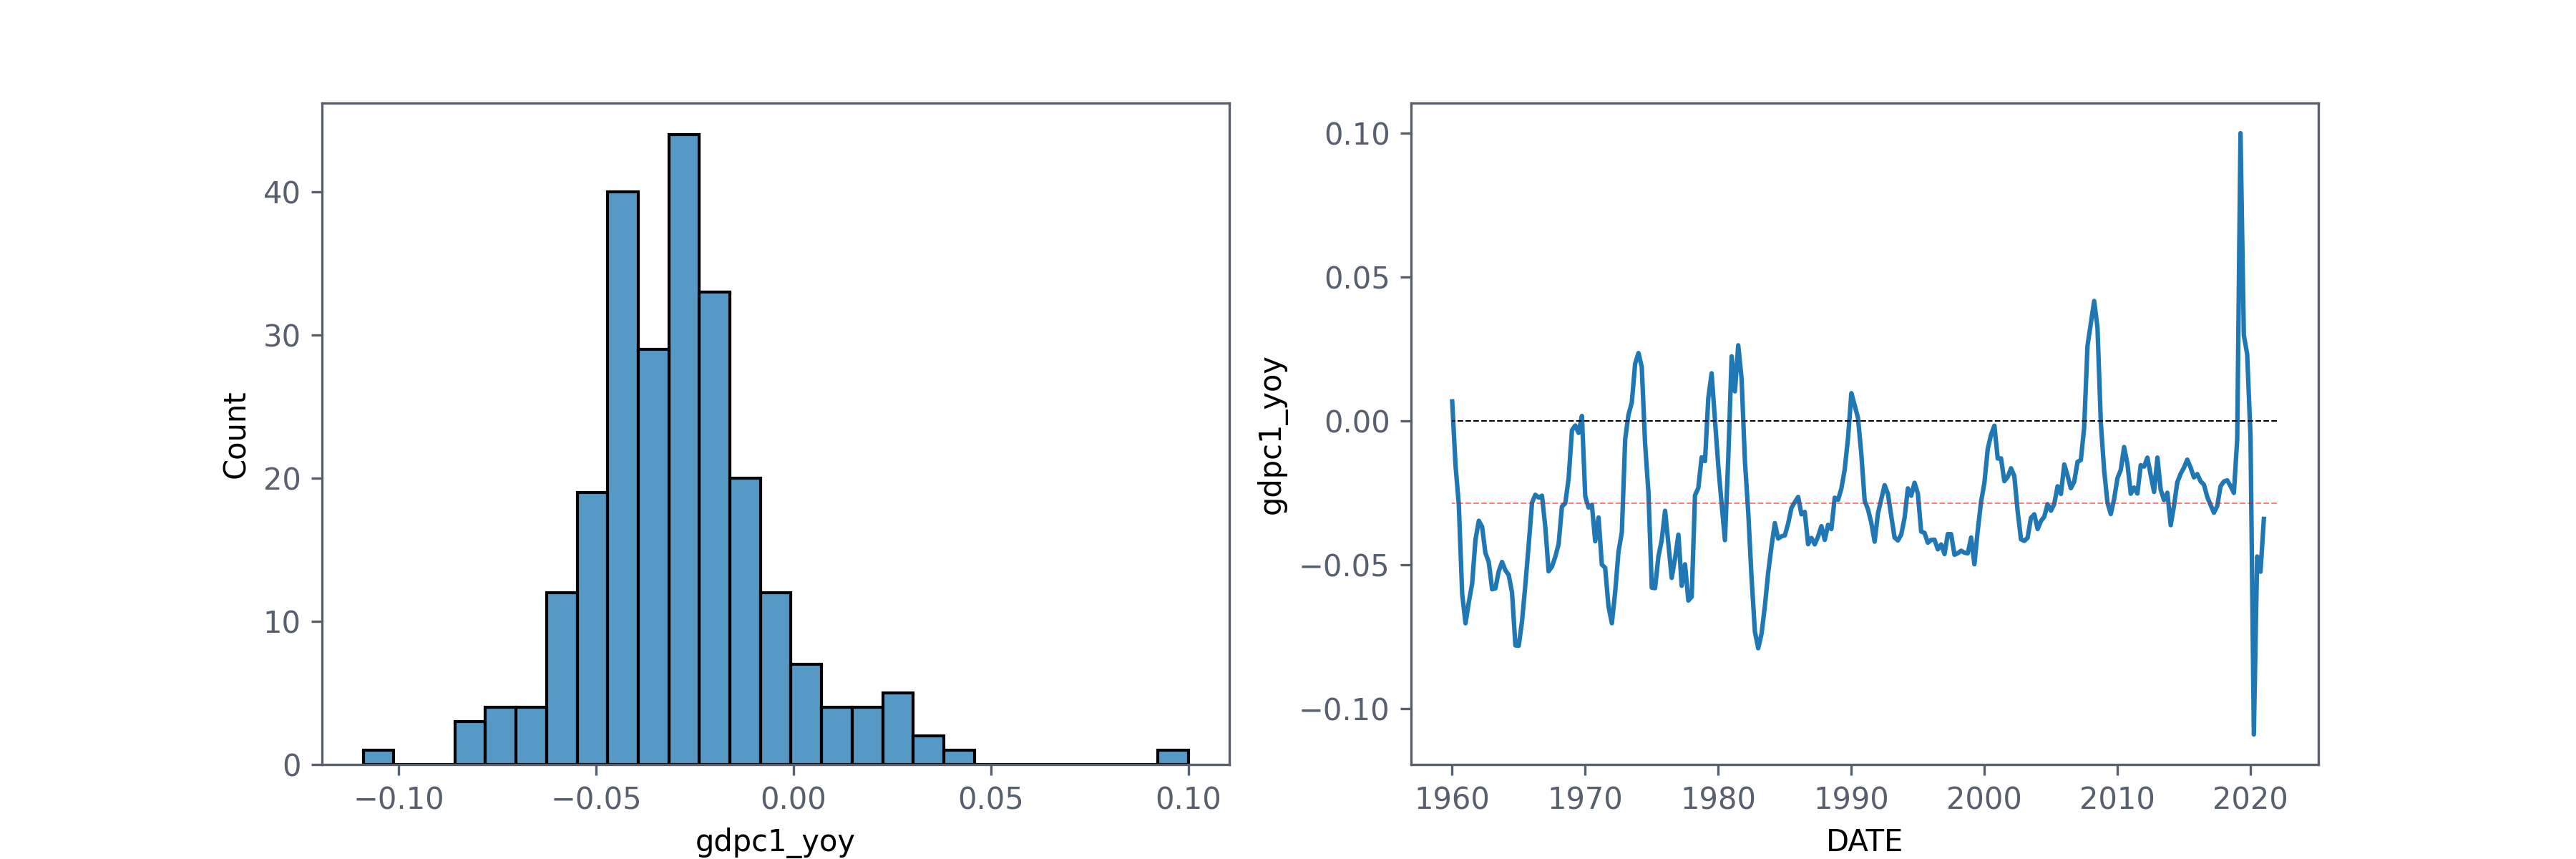
Nominal GDP
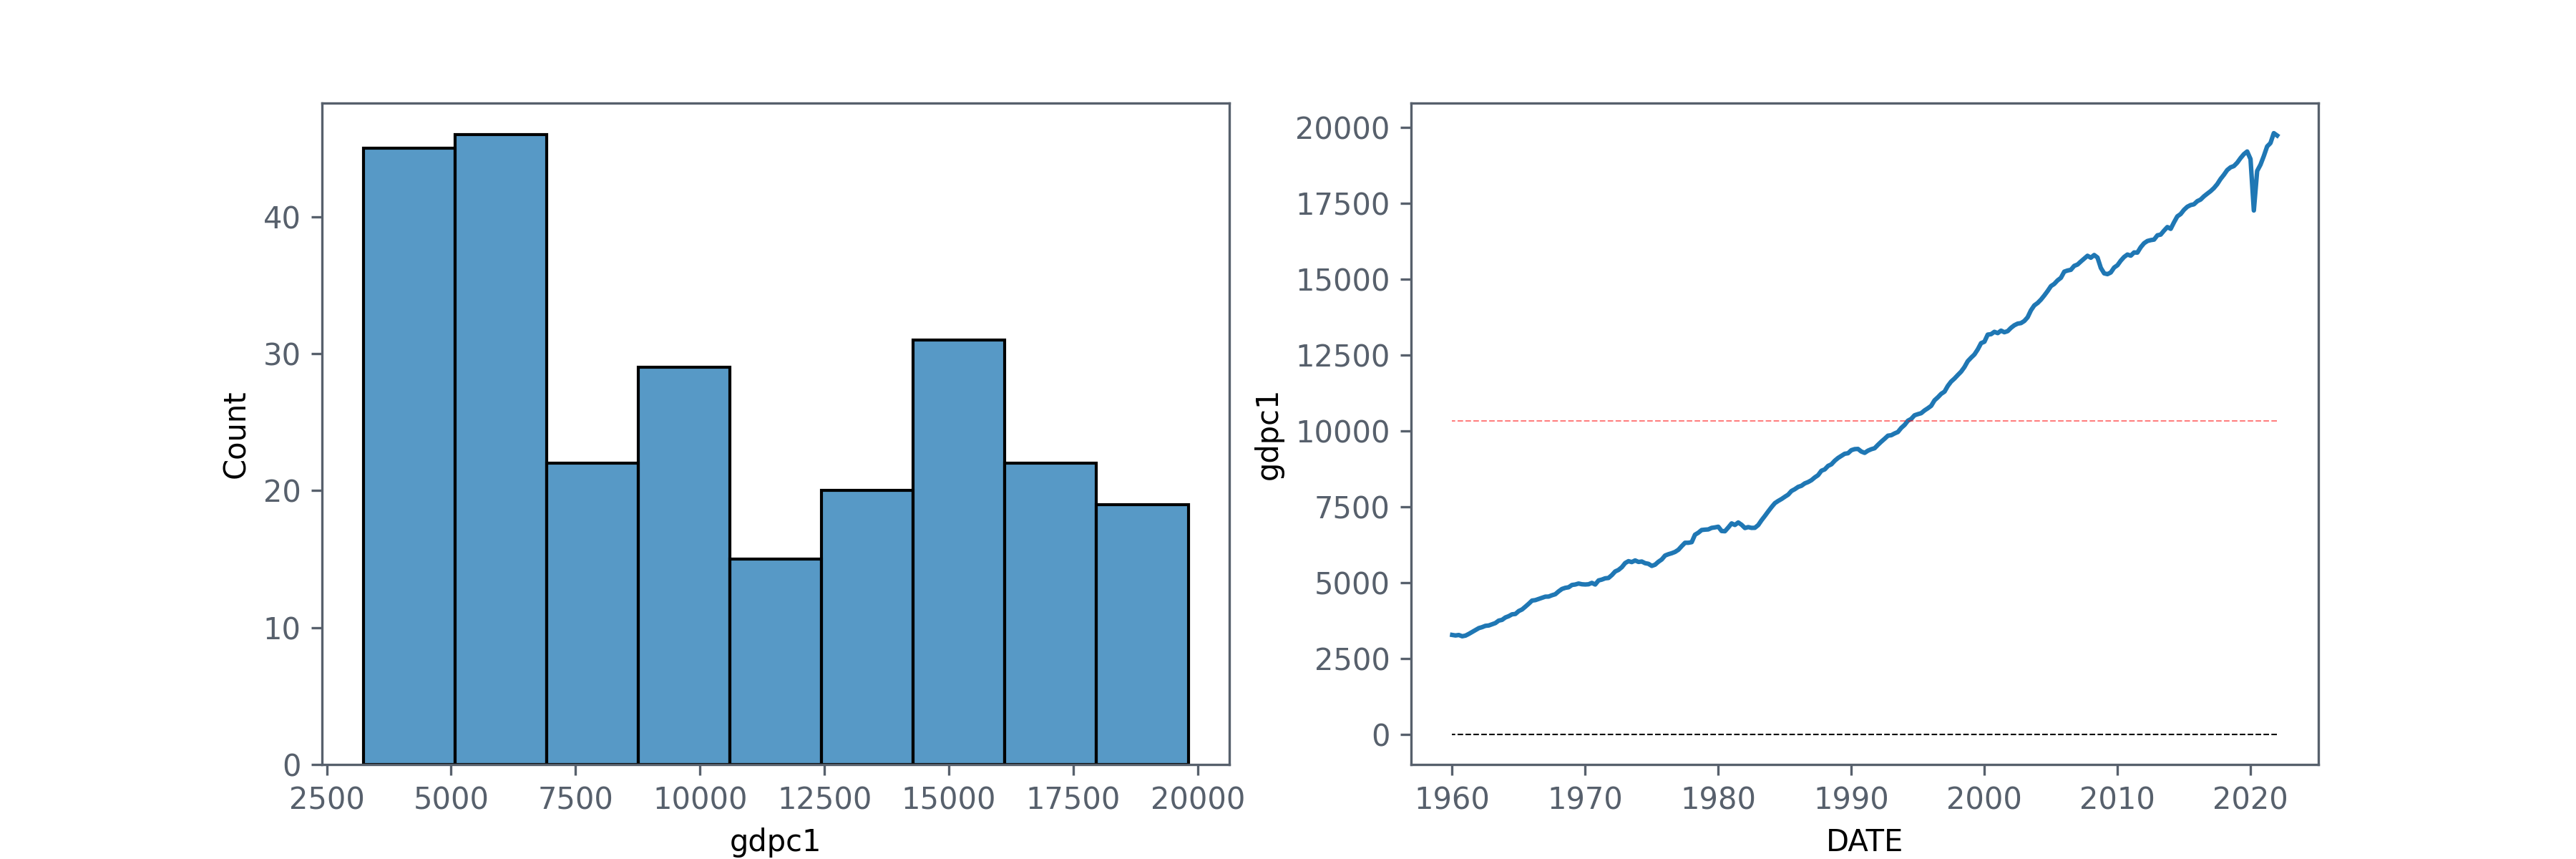
Real GDP (inflation adjusted)
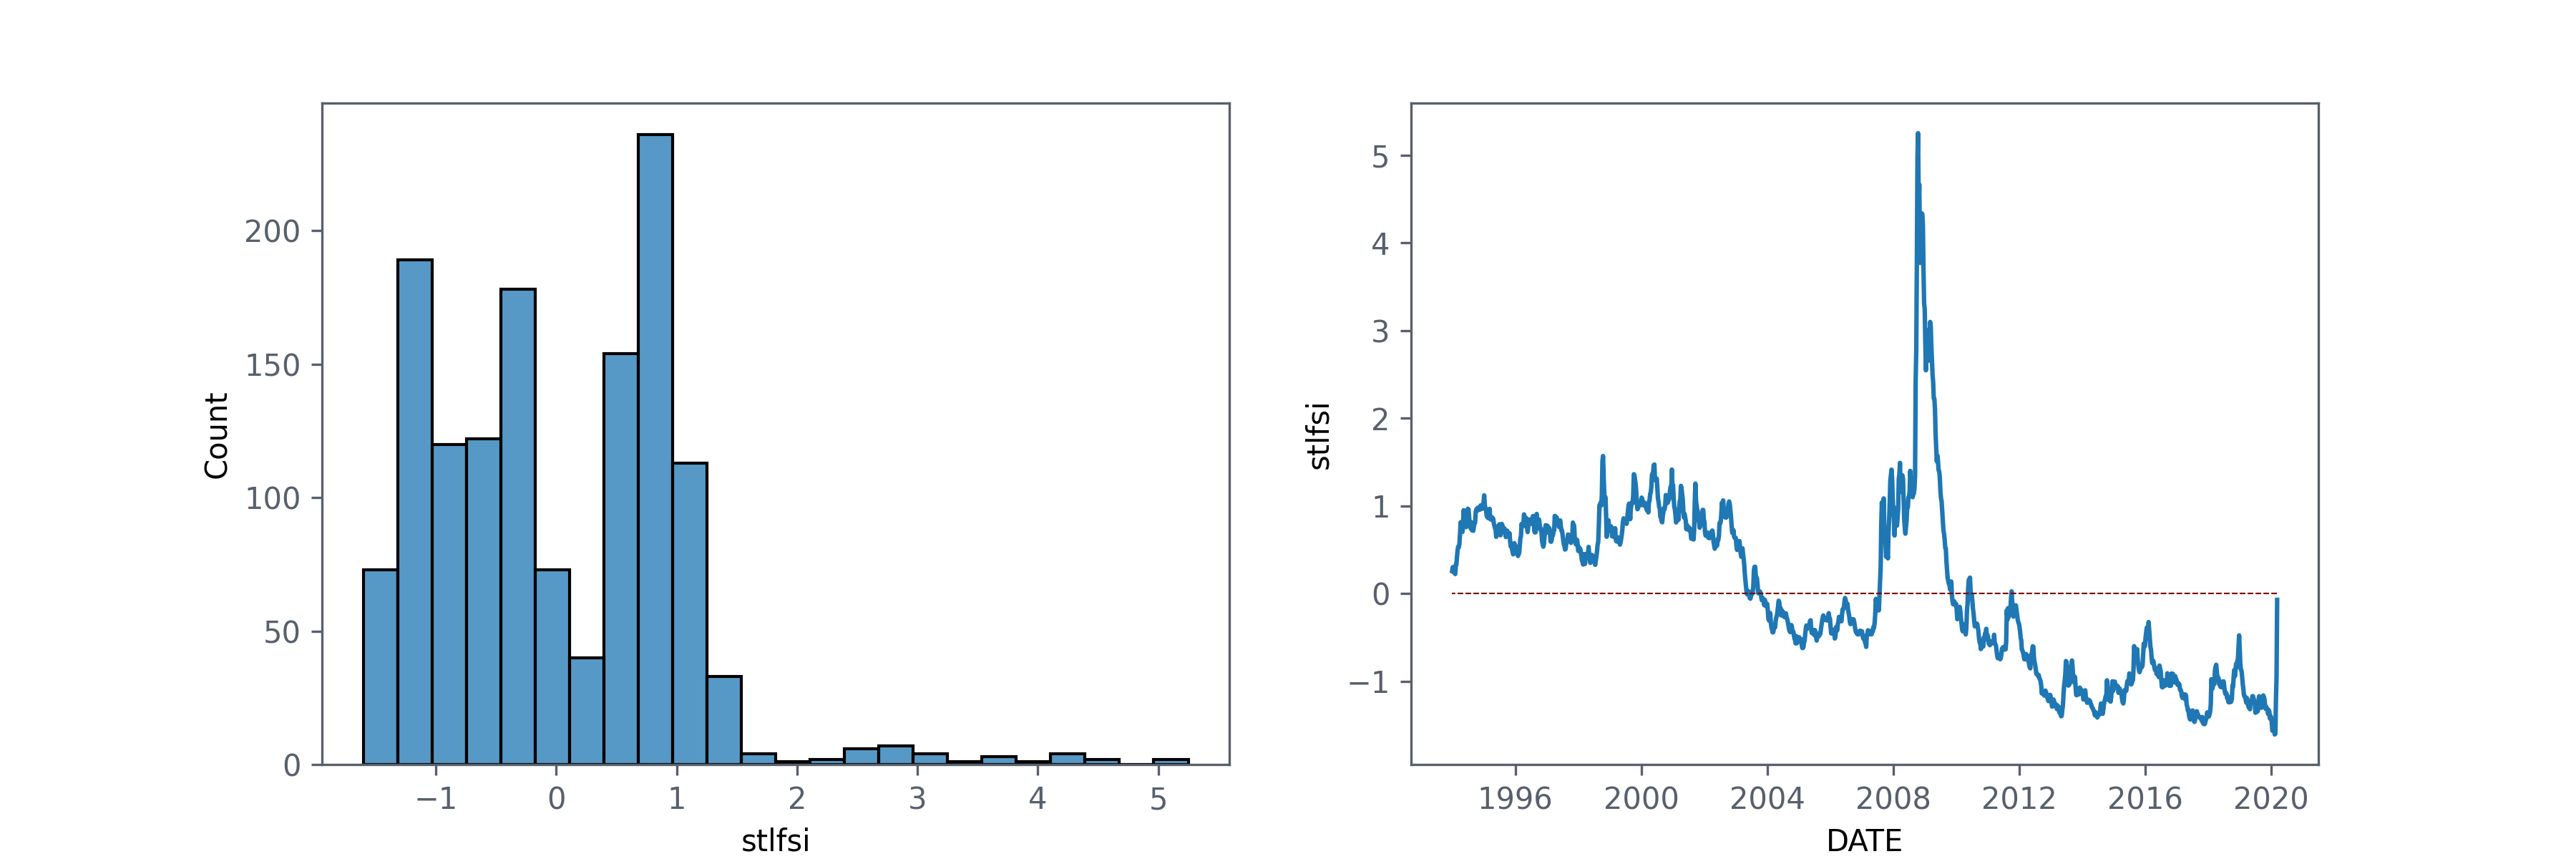
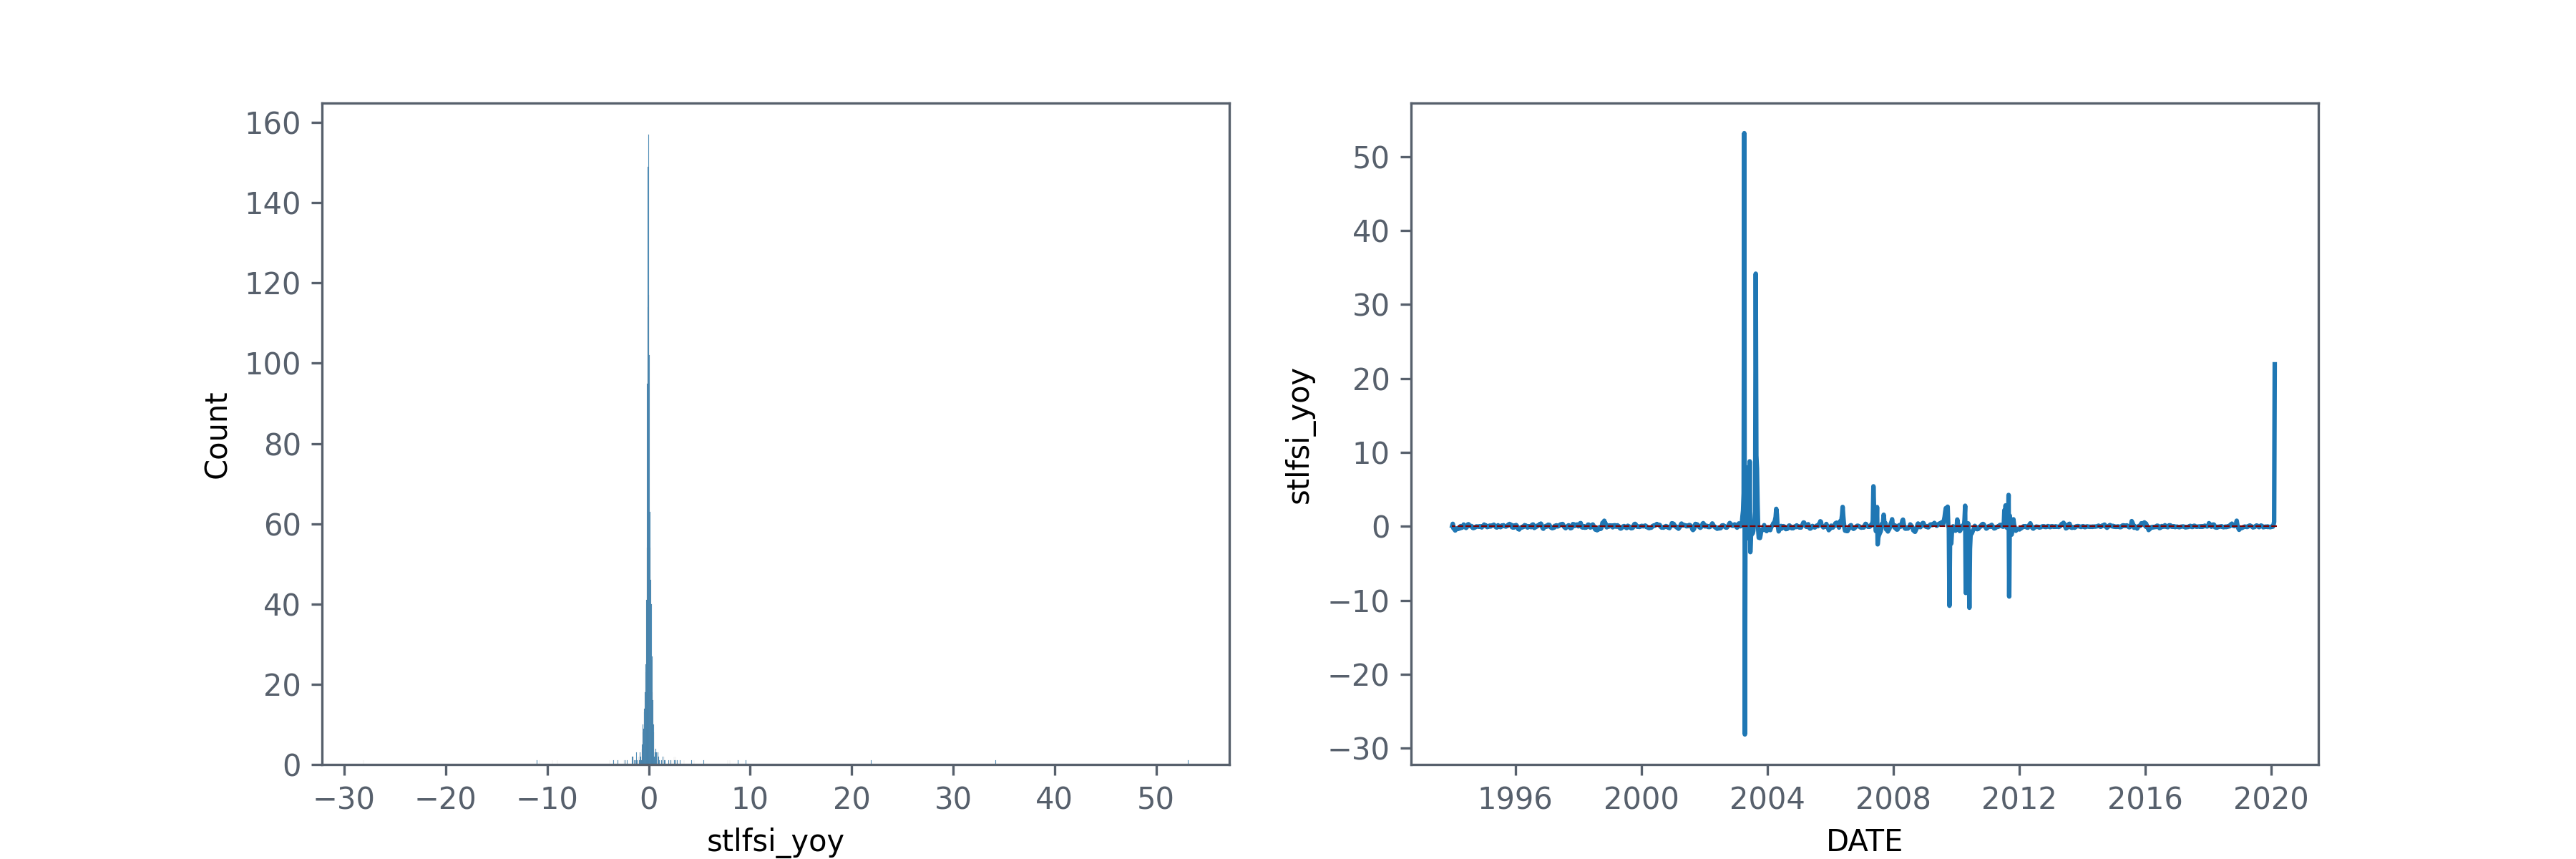
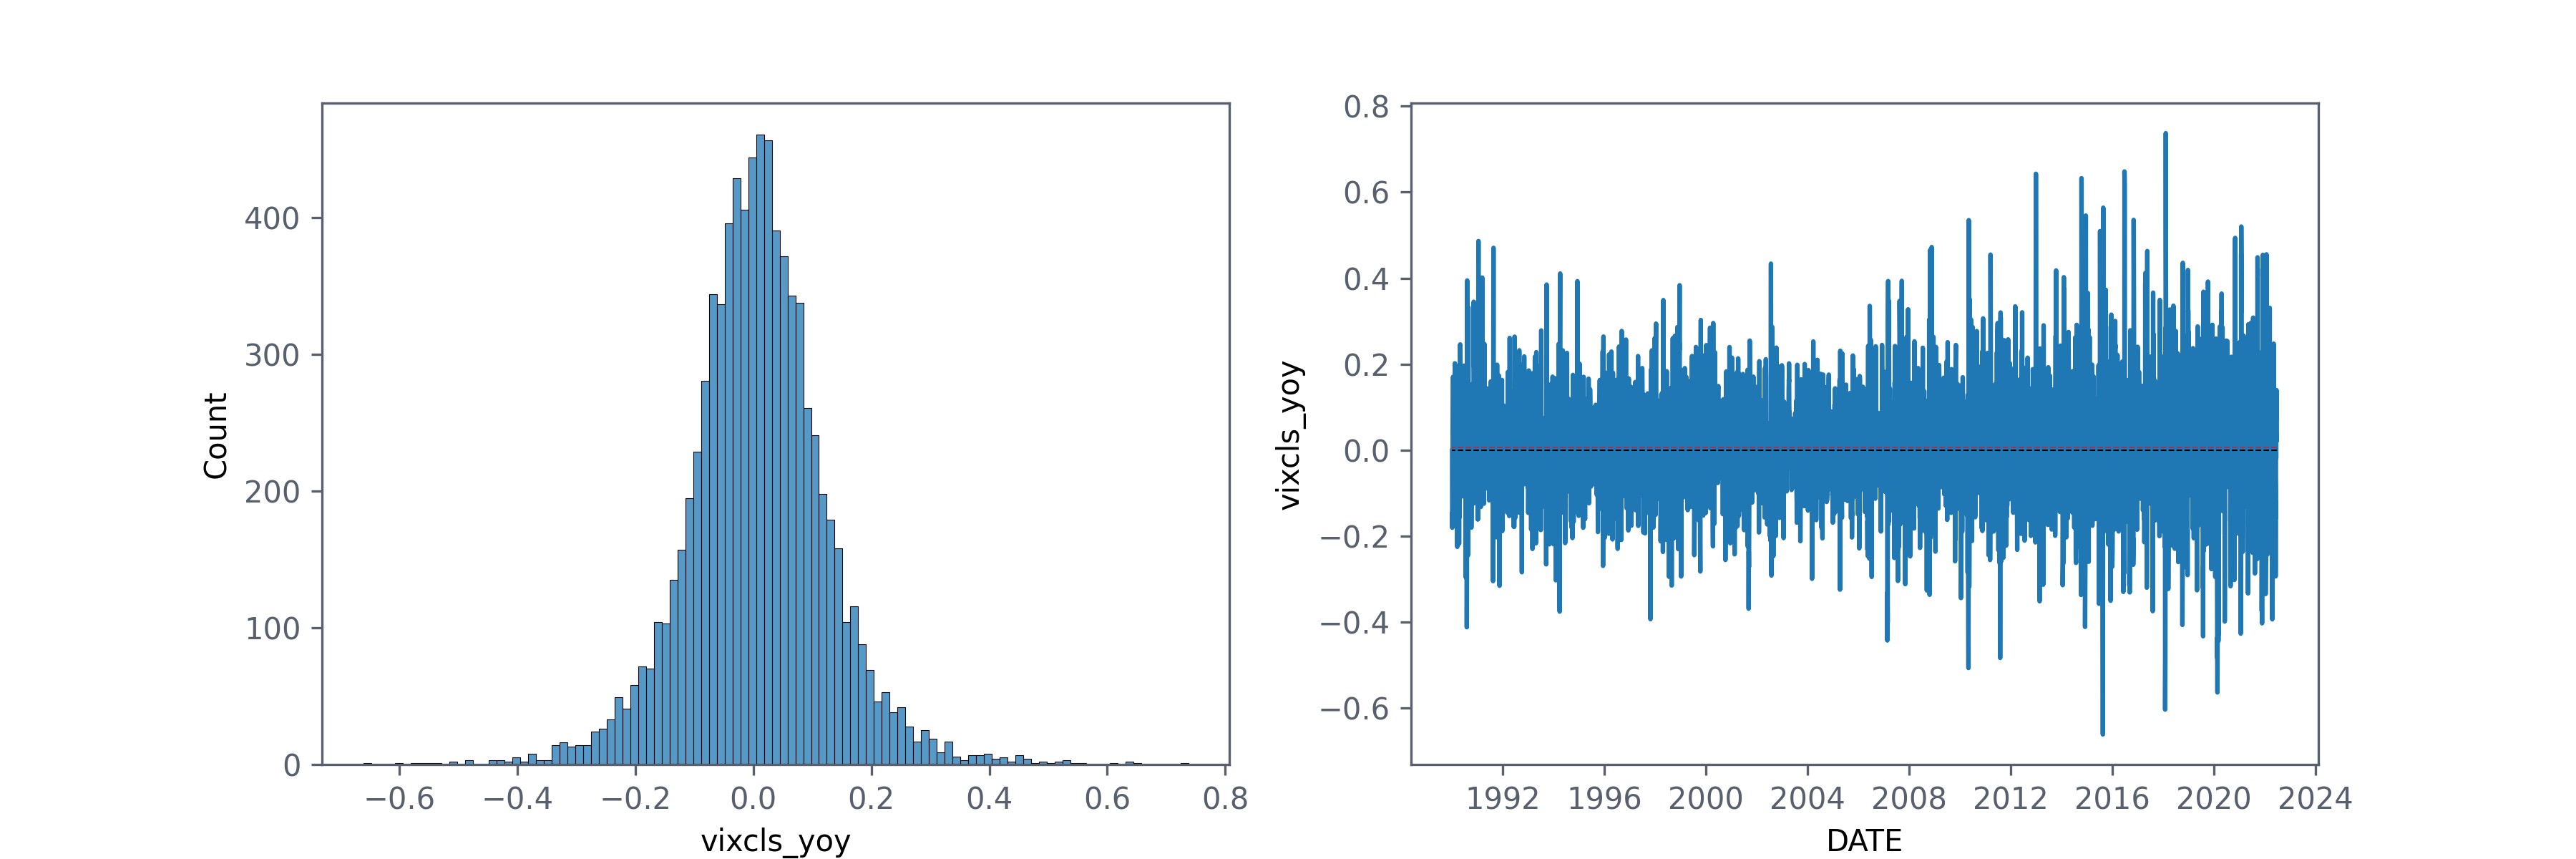
5. Financial stress and volatility
Financial stress
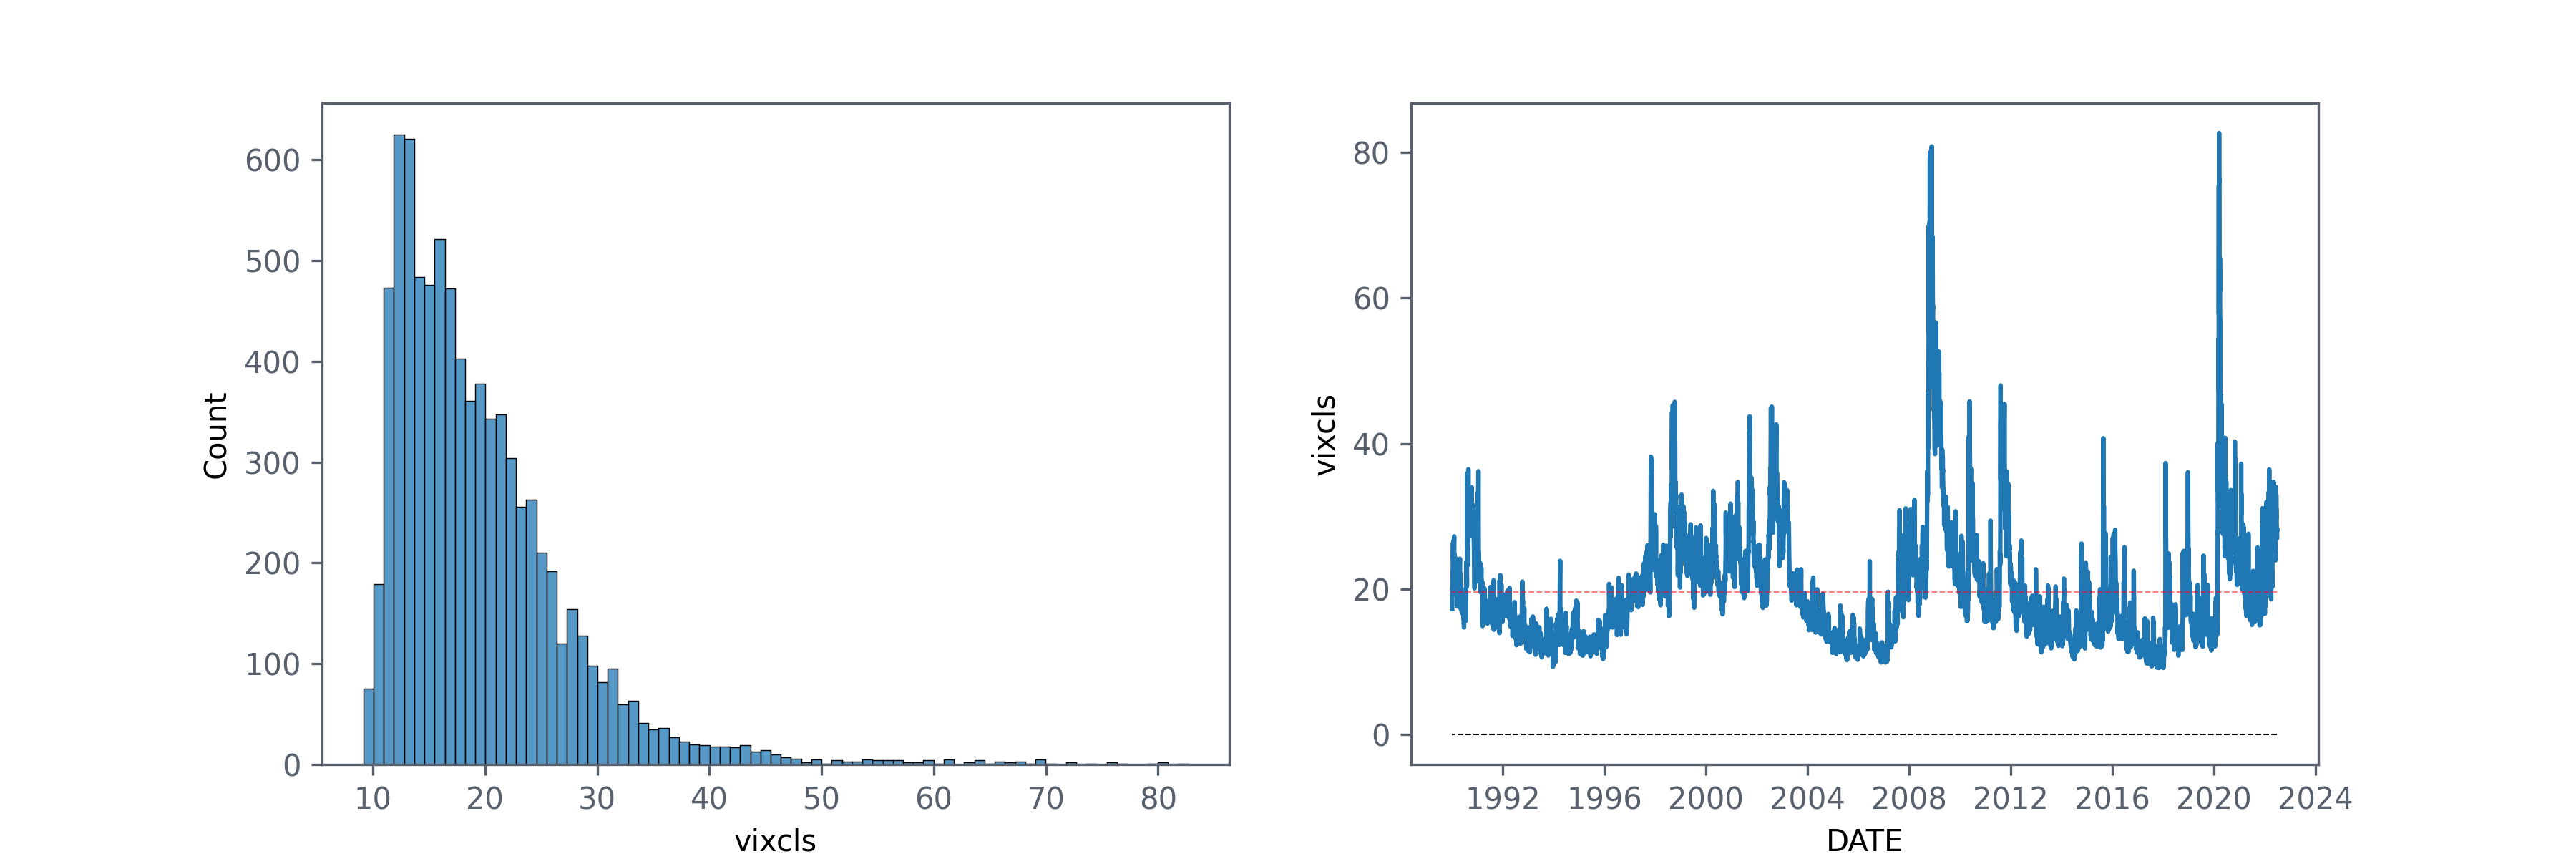
VIX
Complete Fed Funds History from Fred
| fedfunds | fedfunds_mom | fedfunds_yoy | |
|---|---|---|---|
| 1960-01-01 | 3.99 | nan | nan |
| 1960-02-01 | 3.97 | -0.5 | nan |
| 1960-03-01 | 3.84 | -3.27 | nan |
| 1960-04-01 | 3.92 | 2.08 | nan |
| 1960-05-01 | 3.85 | -1.79 | nan |
| 1960-06-01 | 3.32 | -13.77 | nan |
| 1960-07-01 | 3.23 | -2.71 | nan |
| 1960-08-01 | 2.98 | -7.74 | nan |
| 1960-09-01 | 2.6 | -12.75 | nan |
| 1960-10-01 | 2.47 | -5 | nan |
| 1960-11-01 | 2.44 | -1.21 | nan |
| 1960-12-01 | 1.98 | -18.85 | nan |
| 1961-01-01 | 1.45 | -26.77 | -63.66 |
| 1961-02-01 | 2.54 | 75.17 | -36.02 |
| 1961-03-01 | 2.02 | -20.47 | -47.4 |
| 1961-04-01 | 1.49 | -26.24 | -61.99 |
| 1961-05-01 | 1.98 | 32.89 | -48.57 |
| 1961-06-01 | 1.73 | -12.63 | -47.89 |
| 1961-07-01 | 1.17 | -32.37 | -63.78 |
| 1961-08-01 | 2 | 70.94 | -32.89 |
| 1961-09-01 | 1.88 | -6 | -27.69 |
| 1961-10-01 | 2.26 | 20.21 | -8.5 |
| 1961-11-01 | 2.61 | 15.49 | 6.97 |
| 1961-12-01 | 2.33 | -10.73 | 17.68 |
| 1962-01-01 | 2.15 | -7.73 | 48.28 |
| 1962-02-01 | 2.37 | 10.23 | -6.69 |
| 1962-03-01 | 2.85 | 20.25 | 41.09 |
| 1962-04-01 | 2.78 | -2.46 | 86.58 |
| 1962-05-01 | 2.36 | -15.11 | 19.19 |
| 1962-06-01 | 2.68 | 13.56 | 54.91 |
| 1962-07-01 | 2.71 | 1.12 | 131.62 |
| 1962-08-01 | 2.93 | 8.12 | 46.5 |
| 1962-09-01 | 2.9 | -1.02 | 54.26 |
| 1962-10-01 | 2.9 | 0 | 28.32 |
| 1962-11-01 | 2.94 | 1.38 | 12.64 |
| 1962-12-01 | 2.93 | -0.34 | 25.75 |
| 1963-01-01 | 2.92 | -0.34 | 35.81 |
| 1963-02-01 | 3 | 2.74 | 26.58 |
| 1963-03-01 | 2.98 | -0.67 | 4.56 |
| 1963-04-01 | 2.9 | -2.68 | 4.32 |
| 1963-05-01 | 3 | 3.45 | 27.12 |
| 1963-06-01 | 2.99 | -0.33 | 11.57 |
| 1963-07-01 | 3.02 | 1 | 11.44 |
| 1963-08-01 | 3.49 | 15.56 | 19.11 |
| 1963-09-01 | 3.48 | -0.29 | 20 |
| 1963-10-01 | 3.5 | 0.57 | 20.69 |
| 1963-11-01 | 3.48 | -0.57 | 18.37 |
| 1963-12-01 | 3.38 | -2.87 | 15.36 |
| 1964-01-01 | 3.48 | 2.96 | 19.18 |
| 1964-02-01 | 3.48 | 0 | 16 |
| 1964-03-01 | 3.43 | -1.44 | 15.1 |
| 1964-04-01 | 3.47 | 1.17 | 19.66 |
| 1964-05-01 | 3.5 | 0.86 | 16.67 |
| 1964-06-01 | 3.5 | 0 | 17.06 |
| 1964-07-01 | 3.42 | -2.29 | 13.25 |
| 1964-08-01 | 3.5 | 2.34 | 0.29 |
| 1964-09-01 | 3.45 | -1.43 | -0.86 |
| 1964-10-01 | 3.36 | -2.61 | -4 |
| 1964-11-01 | 3.52 | 4.76 | 1.15 |
| 1964-12-01 | 3.85 | 9.38 | 13.91 |
| 1965-01-01 | 3.9 | 1.3 | 12.07 |
| 1965-02-01 | 3.98 | 2.05 | 14.37 |
| 1965-03-01 | 4.05 | 1.76 | 18.08 |
| 1965-04-01 | 4.09 | 0.99 | 17.87 |
| 1965-05-01 | 4.1 | 0.24 | 17.14 |
| 1965-06-01 | 4.05 | -1.22 | 15.71 |
| 1965-07-01 | 4.09 | 0.99 | 19.59 |
| 1965-08-01 | 4.12 | 0.73 | 17.71 |
| 1965-09-01 | 4.02 | -2.43 | 16.52 |
| 1965-10-01 | 4.08 | 1.49 | 21.43 |
| 1965-11-01 | 4.1 | 0.49 | 16.48 |
| 1965-12-01 | 4.32 | 5.37 | 12.21 |
| 1966-01-01 | 4.42 | 2.31 | 13.33 |
| 1966-02-01 | 4.6 | 4.07 | 15.58 |
| 1966-03-01 | 4.66 | 1.3 | 15.06 |
| 1966-04-01 | 4.67 | 0.21 | 14.18 |
| 1966-05-01 | 4.9 | 4.93 | 19.51 |
| 1966-06-01 | 5.17 | 5.51 | 27.65 |
| 1966-07-01 | 5.3 | 2.51 | 29.58 |
| 1966-08-01 | 5.53 | 4.34 | 34.22 |
| 1966-09-01 | 5.4 | -2.35 | 34.33 |
| 1966-10-01 | 5.53 | 2.41 | 35.54 |
| 1966-11-01 | 5.76 | 4.16 | 40.49 |
| 1966-12-01 | 5.4 | -6.25 | 25 |
| 1967-01-01 | 4.94 | -8.52 | 11.76 |
| 1967-02-01 | 5 | 1.21 | 8.7 |
| 1967-03-01 | 4.53 | -9.4 | -2.79 |
| 1967-04-01 | 4.05 | -10.6 | -13.28 |
| 1967-05-01 | 3.94 | -2.72 | -19.59 |
| 1967-06-01 | 3.98 | 1.02 | -23.02 |
| 1967-07-01 | 3.79 | -4.77 | -28.49 |
| 1967-08-01 | 3.9 | 2.9 | -29.48 |
| 1967-09-01 | 3.99 | 2.31 | -26.11 |
| 1967-10-01 | 3.88 | -2.76 | -29.84 |
| 1967-11-01 | 4.13 | 6.44 | -28.3 |
| 1967-12-01 | 4.51 | 9.2 | -16.48 |
| 1968-01-01 | 4.61 | 2.22 | -6.68 |
| 1968-02-01 | 4.71 | 2.17 | -5.8 |
| 1968-03-01 | 5.05 | 7.22 | 11.48 |
| 1968-04-01 | 5.76 | 14.06 | 42.22 |
| 1968-05-01 | 6.12 | 6.25 | 55.33 |
| 1968-06-01 | 6.07 | -0.82 | 52.51 |
| 1968-07-01 | 6.03 | -0.66 | 59.1 |
| 1968-08-01 | 6.03 | 0 | 54.62 |
| 1968-09-01 | 5.78 | -4.15 | 44.86 |
| 1968-10-01 | 5.91 | 2.25 | 52.32 |
| 1968-11-01 | 5.82 | -1.52 | 40.92 |
| 1968-12-01 | 6.02 | 3.44 | 33.48 |
| 1969-01-01 | 6.3 | 4.65 | 36.66 |
| 1969-02-01 | 6.61 | 4.92 | 40.34 |
| 1969-03-01 | 6.79 | 2.72 | 34.46 |
| 1969-04-01 | 7.41 | 9.13 | 28.65 |
| 1969-05-01 | 8.67 | 17 | 41.67 |
| 1969-06-01 | 8.9 | 2.65 | 46.62 |
| 1969-07-01 | 8.61 | -3.26 | 42.79 |
| 1969-08-01 | 9.19 | 6.74 | 52.4 |
| 1969-09-01 | 9.15 | -0.44 | 58.3 |
| 1969-10-01 | 9 | -1.64 | 52.28 |
| 1969-11-01 | 8.85 | -1.67 | 52.06 |
| 1969-12-01 | 8.97 | 1.36 | 49 |
| 1970-01-01 | 8.98 | 0.11 | 42.54 |
| 1970-02-01 | 8.98 | 0 | 35.85 |
| 1970-03-01 | 7.76 | -13.59 | 14.29 |
| 1970-04-01 | 8.1 | 4.38 | 9.31 |
| 1970-05-01 | 7.95 | -1.85 | -8.3 |
| 1970-06-01 | 7.61 | -4.28 | -14.49 |
| 1970-07-01 | 7.21 | -5.26 | -16.26 |
| 1970-08-01 | 6.62 | -8.18 | -27.97 |
| 1970-09-01 | 6.29 | -4.98 | -31.26 |
| 1970-10-01 | 6.2 | -1.43 | -31.11 |
| 1970-11-01 | 5.6 | -9.68 | -36.72 |
| 1970-12-01 | 4.9 | -12.5 | -45.37 |
| 1971-01-01 | 4.14 | -15.51 | -53.9 |
| 1971-02-01 | 3.72 | -10.14 | -58.57 |
| 1971-03-01 | 3.71 | -0.27 | -52.19 |
| 1971-04-01 | 4.16 | 12.13 | -48.64 |
| 1971-05-01 | 4.63 | 11.3 | -41.76 |
| 1971-06-01 | 4.91 | 6.05 | -35.48 |
| 1971-07-01 | 5.31 | 8.15 | -26.35 |
| 1971-08-01 | 5.57 | 4.9 | -15.86 |
| 1971-09-01 | 5.55 | -0.36 | -11.76 |
| 1971-10-01 | 5.2 | -6.31 | -16.13 |
| 1971-11-01 | 4.91 | -5.58 | -12.32 |
| 1971-12-01 | 4.14 | -15.68 | -15.51 |
| 1972-01-01 | 3.51 | -15.22 | -15.22 |
| 1972-02-01 | 3.3 | -5.98 | -11.29 |
| 1972-03-01 | 3.83 | 16.06 | 3.23 |
| 1972-04-01 | 4.17 | 8.88 | 0.24 |
| 1972-05-01 | 4.27 | 2.4 | -7.78 |
| 1972-06-01 | 4.46 | 4.45 | -9.16 |
| 1972-07-01 | 4.55 | 2.02 | -14.31 |
| 1972-08-01 | 4.81 | 5.71 | -13.64 |
| 1972-09-01 | 4.87 | 1.25 | -12.25 |
| 1972-10-01 | 5.05 | 3.7 | -2.88 |
| 1972-11-01 | 5.06 | 0.2 | 3.05 |
| 1972-12-01 | 5.33 | 5.34 | 28.74 |
| 1973-01-01 | 5.94 | 11.44 | 69.23 |
| 1973-02-01 | 6.58 | 10.77 | 99.39 |
| 1973-03-01 | 7.09 | 7.75 | 85.12 |
| 1973-04-01 | 7.12 | 0.42 | 70.74 |
| 1973-05-01 | 7.84 | 10.11 | 83.61 |
| 1973-06-01 | 8.49 | 8.29 | 90.36 |
| 1973-07-01 | 10.4 | 22.5 | 128.57 |
| 1973-08-01 | 10.5 | 0.96 | 118.3 |
| 1973-09-01 | 10.78 | 2.67 | 121.36 |
| 1973-10-01 | 10.01 | -7.14 | 98.22 |
| 1973-11-01 | 10.03 | 0.2 | 98.22 |
| 1973-12-01 | 9.95 | -0.8 | 86.68 |
| 1974-01-01 | 9.65 | -3.02 | 62.46 |
| 1974-02-01 | 8.97 | -7.05 | 36.32 |
| 1974-03-01 | 9.35 | 4.24 | 31.88 |
| 1974-04-01 | 10.51 | 12.41 | 47.61 |
| 1974-05-01 | 11.31 | 7.61 | 44.26 |
| 1974-06-01 | 11.93 | 5.48 | 40.52 |
| 1974-07-01 | 12.92 | 8.3 | 24.23 |
| 1974-08-01 | 12.01 | -7.04 | 14.38 |
| 1974-09-01 | 11.34 | -5.58 | 5.19 |
| 1974-10-01 | 10.06 | -11.29 | 0.5 |
| 1974-11-01 | 9.45 | -6.06 | -5.78 |
| 1974-12-01 | 8.53 | -9.74 | -14.27 |
| 1975-01-01 | 7.13 | -16.41 | -26.11 |
| 1975-02-01 | 6.24 | -12.48 | -30.43 |
| 1975-03-01 | 5.54 | -11.22 | -40.75 |
| 1975-04-01 | 5.49 | -0.9 | -47.76 |
| 1975-05-01 | 5.22 | -4.92 | -53.85 |
| 1975-06-01 | 5.55 | 6.32 | -53.48 |
| 1975-07-01 | 6.1 | 9.91 | -52.79 |
| 1975-08-01 | 6.14 | 0.66 | -48.88 |
| 1975-09-01 | 6.24 | 1.63 | -44.97 |
| 1975-10-01 | 5.82 | -6.73 | -42.15 |
| 1975-11-01 | 5.22 | -10.31 | -44.76 |
| 1975-12-01 | 5.2 | -0.38 | -39.04 |
| 1976-01-01 | 4.87 | -6.35 | -31.7 |
| 1976-02-01 | 4.77 | -2.05 | -23.56 |
| 1976-03-01 | 4.84 | 1.47 | -12.64 |
| 1976-04-01 | 4.82 | -0.41 | -12.2 |
| 1976-05-01 | 5.29 | 9.75 | 1.34 |
| 1976-06-01 | 5.48 | 3.59 | -1.26 |
| 1976-07-01 | 5.31 | -3.1 | -12.95 |
| 1976-08-01 | 5.29 | -0.38 | -13.84 |
| 1976-09-01 | 5.25 | -0.76 | -15.87 |
| 1976-10-01 | 5.02 | -4.38 | -13.75 |
| 1976-11-01 | 4.95 | -1.39 | -5.17 |
| 1976-12-01 | 4.65 | -6.06 | -10.58 |
| 1977-01-01 | 4.61 | -0.86 | -5.34 |
| 1977-02-01 | 4.68 | 1.52 | -1.89 |
| 1977-03-01 | 4.69 | 0.21 | -3.1 |
| 1977-04-01 | 4.73 | 0.85 | -1.87 |
| 1977-05-01 | 5.35 | 13.11 | 1.13 |
| 1977-06-01 | 5.39 | 0.75 | -1.64 |
| 1977-07-01 | 5.42 | 0.56 | 2.07 |
| 1977-08-01 | 5.9 | 8.86 | 11.53 |
| 1977-09-01 | 6.14 | 4.07 | 16.95 |
| 1977-10-01 | 6.47 | 5.37 | 28.88 |
| 1977-11-01 | 6.51 | 0.62 | 31.52 |
| 1977-12-01 | 6.56 | 0.77 | 41.08 |
| 1978-01-01 | 6.7 | 2.13 | 45.34 |
| 1978-02-01 | 6.78 | 1.19 | 44.87 |
| 1978-03-01 | 6.79 | 0.15 | 44.78 |
| 1978-04-01 | 6.89 | 1.47 | 45.67 |
| 1978-05-01 | 7.36 | 6.82 | 37.57 |
| 1978-06-01 | 7.6 | 3.26 | 41 |
| 1978-07-01 | 7.81 | 2.76 | 44.1 |
| 1978-08-01 | 8.04 | 2.94 | 36.27 |
| 1978-09-01 | 8.45 | 5.1 | 37.62 |
| 1978-10-01 | 8.96 | 6.04 | 38.49 |
| 1978-11-01 | 9.76 | 8.93 | 49.92 |
| 1978-12-01 | 10.03 | 2.77 | 52.9 |
| 1979-01-01 | 10.07 | 0.4 | 50.3 |
| 1979-02-01 | 10.06 | -0.1 | 48.38 |
| 1979-03-01 | 10.09 | 0.3 | 48.6 |
| 1979-04-01 | 10.01 | -0.79 | 45.28 |
| 1979-05-01 | 10.24 | 2.3 | 39.13 |
| 1979-06-01 | 10.29 | 0.49 | 35.39 |
| 1979-07-01 | 10.47 | 1.75 | 34.06 |
| 1979-08-01 | 10.94 | 4.49 | 36.07 |
| 1979-09-01 | 11.43 | 4.48 | 35.27 |
| 1979-10-01 | 13.77 | 20.47 | 53.68 |
| 1979-11-01 | 13.18 | -4.28 | 35.04 |
| 1979-12-01 | 13.78 | 4.55 | 37.39 |
| 1980-01-01 | 13.82 | 0.29 | 37.24 |
| 1980-02-01 | 14.13 | 2.24 | 40.46 |
| 1980-03-01 | 17.19 | 21.66 | 70.37 |
| 1980-04-01 | 17.61 | 2.44 | 75.92 |
| 1980-05-01 | 10.98 | -37.65 | 7.23 |
| 1980-06-01 | 9.47 | -13.75 | -7.97 |
| 1980-07-01 | 9.03 | -4.65 | -13.75 |
| 1980-08-01 | 9.61 | 6.42 | -12.16 |
| 1980-09-01 | 10.87 | 13.11 | -4.9 |
| 1980-10-01 | 12.81 | 17.85 | -6.97 |
| 1980-11-01 | 15.85 | 23.73 | 20.26 |
| 1980-12-01 | 18.9 | 19.24 | 37.16 |
| 1981-01-01 | 19.08 | 0.95 | 38.06 |
| 1981-02-01 | 15.93 | -16.51 | 12.74 |
| 1981-03-01 | 14.7 | -7.72 | -14.49 |
| 1981-04-01 | 15.72 | 6.94 | -10.73 |
| 1981-05-01 | 18.52 | 17.81 | 68.67 |
| 1981-06-01 | 19.1 | 3.13 | 101.69 |
| 1981-07-01 | 19.04 | -0.31 | 110.85 |
| 1981-08-01 | 17.82 | -6.41 | 85.43 |
| 1981-09-01 | 15.87 | -10.94 | 46 |
| 1981-10-01 | 15.08 | -4.98 | 17.72 |
| 1981-11-01 | 13.31 | -11.74 | -16.03 |
| 1981-12-01 | 12.37 | -7.06 | -34.55 |
| 1982-01-01 | 13.22 | 6.87 | -30.71 |
| 1982-02-01 | 14.78 | 11.8 | -7.22 |
| 1982-03-01 | 14.68 | -0.68 | -0.14 |
| 1982-04-01 | 14.94 | 1.77 | -4.96 |
| 1982-05-01 | 14.45 | -3.28 | -21.98 |
| 1982-06-01 | 14.15 | -2.08 | -25.92 |
| 1982-07-01 | 12.59 | -11.02 | -33.88 |
| 1982-08-01 | 10.12 | -19.62 | -43.21 |
| 1982-09-01 | 10.31 | 1.88 | -35.03 |
| 1982-10-01 | 9.71 | -5.82 | -35.61 |
| 1982-11-01 | 9.2 | -5.25 | -30.88 |
| 1982-12-01 | 8.95 | -2.72 | -27.65 |
| 1983-01-01 | 8.68 | -3.02 | -34.34 |
| 1983-02-01 | 8.51 | -1.96 | -42.42 |
| 1983-03-01 | 8.77 | 3.06 | -40.26 |
| 1983-04-01 | 8.8 | 0.34 | -41.1 |
| 1983-05-01 | 8.63 | -1.93 | -40.28 |
| 1983-06-01 | 8.98 | 4.06 | -36.54 |
| 1983-07-01 | 9.37 | 4.34 | -25.58 |
| 1983-08-01 | 9.56 | 2.03 | -5.53 |
| 1983-09-01 | 9.45 | -1.15 | -8.34 |
| 1983-10-01 | 9.48 | 0.32 | -2.37 |
| 1983-11-01 | 9.34 | -1.48 | 1.52 |
| 1983-12-01 | 9.47 | 1.39 | 5.81 |
| 1984-01-01 | 9.56 | 0.95 | 10.14 |
| 1984-02-01 | 9.59 | 0.31 | 12.69 |
| 1984-03-01 | 9.91 | 3.34 | 13 |
| 1984-04-01 | 10.29 | 3.83 | 16.93 |
| 1984-05-01 | 10.32 | 0.29 | 19.58 |
| 1984-06-01 | 11.06 | 7.17 | 23.16 |
| 1984-07-01 | 11.23 | 1.54 | 19.85 |
| 1984-08-01 | 11.64 | 3.65 | 21.76 |
| 1984-09-01 | 11.3 | -2.92 | 19.58 |
| 1984-10-01 | 9.99 | -11.59 | 5.38 |
| 1984-11-01 | 9.43 | -5.61 | 0.96 |
| 1984-12-01 | 8.38 | -11.13 | -11.51 |
| 1985-01-01 | 8.35 | -0.36 | -12.66 |
| 1985-02-01 | 8.5 | 1.8 | -11.37 |
| 1985-03-01 | 8.58 | 0.94 | -13.42 |
| 1985-04-01 | 8.27 | -3.61 | -19.63 |
| 1985-05-01 | 7.97 | -3.63 | -22.77 |
| 1985-06-01 | 7.53 | -5.52 | -31.92 |
| 1985-07-01 | 7.88 | 4.65 | -29.83 |
| 1985-08-01 | 7.9 | 0.25 | -32.13 |
| 1985-09-01 | 7.92 | 0.25 | -29.91 |
| 1985-10-01 | 7.99 | 0.88 | -20.02 |
| 1985-11-01 | 8.05 | 0.75 | -14.63 |
| 1985-12-01 | 8.27 | 2.73 | -1.31 |
| 1986-01-01 | 8.14 | -1.57 | -2.51 |
| 1986-02-01 | 7.86 | -3.44 | -7.53 |
| 1986-03-01 | 7.48 | -4.83 | -12.82 |
| 1986-04-01 | 6.99 | -6.55 | -15.48 |
| 1986-05-01 | 6.85 | -2 | -14.05 |
| 1986-06-01 | 6.92 | 1.02 | -8.1 |
| 1986-07-01 | 6.56 | -5.2 | -16.75 |
| 1986-08-01 | 6.17 | -5.95 | -21.9 |
| 1986-09-01 | 5.89 | -4.54 | -25.63 |
| 1986-10-01 | 5.85 | -0.68 | -26.78 |
| 1986-11-01 | 6.04 | 3.25 | -24.97 |
| 1986-12-01 | 6.91 | 14.4 | -16.44 |
| 1987-01-01 | 6.43 | -6.95 | -21.01 |
| 1987-02-01 | 6.1 | -5.13 | -22.39 |
| 1987-03-01 | 6.13 | 0.49 | -18.05 |
| 1987-04-01 | 6.37 | 3.92 | -8.87 |
| 1987-05-01 | 6.85 | 7.54 | 0 |
| 1987-06-01 | 6.73 | -1.75 | -2.75 |
| 1987-07-01 | 6.58 | -2.23 | 0.3 |
| 1987-08-01 | 6.73 | 2.28 | 9.08 |
| 1987-09-01 | 7.22 | 7.28 | 22.58 |
| 1987-10-01 | 7.29 | 0.97 | 24.62 |
| 1987-11-01 | 6.69 | -8.23 | 10.76 |
| 1987-12-01 | 6.77 | 1.2 | -2.03 |
| 1988-01-01 | 6.83 | 0.89 | 6.22 |
| 1988-02-01 | 6.58 | -3.66 | 7.87 |
| 1988-03-01 | 6.58 | 0 | 7.34 |
| 1988-04-01 | 6.87 | 4.41 | 7.85 |
| 1988-05-01 | 7.09 | 3.2 | 3.5 |
| 1988-06-01 | 7.51 | 5.92 | 11.59 |
| 1988-07-01 | 7.75 | 3.2 | 17.78 |
| 1988-08-01 | 8.01 | 3.35 | 19.02 |
| 1988-09-01 | 8.19 | 2.25 | 13.43 |
| 1988-10-01 | 8.3 | 1.34 | 13.85 |
| 1988-11-01 | 8.35 | 0.6 | 24.81 |
| 1988-12-01 | 8.76 | 4.91 | 29.39 |
| 1989-01-01 | 9.12 | 4.11 | 33.53 |
| 1989-02-01 | 9.36 | 2.63 | 42.25 |
| 1989-03-01 | 9.85 | 5.24 | 49.7 |
| 1989-04-01 | 9.84 | -0.1 | 43.23 |
| 1989-05-01 | 9.81 | -0.3 | 38.36 |
| 1989-06-01 | 9.53 | -2.85 | 26.9 |
| 1989-07-01 | 9.24 | -3.04 | 19.23 |
| 1989-08-01 | 8.99 | -2.71 | 12.23 |
| 1989-09-01 | 9.02 | 0.33 | 10.13 |
| 1989-10-01 | 8.84 | -2 | 6.51 |
| 1989-11-01 | 8.55 | -3.28 | 2.4 |
| 1989-12-01 | 8.45 | -1.17 | -3.54 |
| 1990-01-01 | 8.23 | -2.6 | -9.76 |
| 1990-02-01 | 8.24 | 0.12 | -11.97 |
| 1990-03-01 | 8.28 | 0.49 | -15.94 |
| 1990-04-01 | 8.26 | -0.24 | -16.06 |
| 1990-05-01 | 8.18 | -0.97 | -16.62 |
| 1990-06-01 | 8.29 | 1.34 | -13.01 |
| 1990-07-01 | 8.15 | -1.69 | -11.8 |
| 1990-08-01 | 8.13 | -0.25 | -9.57 |
| 1990-09-01 | 8.2 | 0.86 | -9.09 |
| 1990-10-01 | 8.11 | -1.1 | -8.26 |
| 1990-11-01 | 7.81 | -3.7 | -8.65 |
| 1990-12-01 | 7.31 | -6.4 | -13.49 |
| 1991-01-01 | 6.91 | -5.47 | -16.04 |
| 1991-02-01 | 6.25 | -9.55 | -24.15 |
| 1991-03-01 | 6.12 | -2.08 | -26.09 |
| 1991-04-01 | 5.91 | -3.43 | -28.45 |
| 1991-05-01 | 5.78 | -2.2 | -29.34 |
| 1991-06-01 | 5.9 | 2.08 | -28.83 |
| 1991-07-01 | 5.82 | -1.36 | -28.59 |
| 1991-08-01 | 5.66 | -2.75 | -30.38 |
| 1991-09-01 | 5.45 | -3.71 | -33.54 |
| 1991-10-01 | 5.21 | -4.4 | -35.76 |
| 1991-11-01 | 4.81 | -7.68 | -38.41 |
| 1991-12-01 | 4.43 | -7.9 | -39.4 |
| 1992-01-01 | 4.03 | -9.03 | -41.68 |
| 1992-02-01 | 4.06 | 0.74 | -35.04 |
| 1992-03-01 | 3.98 | -1.97 | -34.97 |
| 1992-04-01 | 3.73 | -6.28 | -36.89 |
| 1992-05-01 | 3.82 | 2.41 | -33.91 |
| 1992-06-01 | 3.76 | -1.57 | -36.27 |
| 1992-07-01 | 3.25 | -13.56 | -44.16 |
| 1992-08-01 | 3.3 | 1.54 | -41.7 |
| 1992-09-01 | 3.22 | -2.42 | -40.92 |
| 1992-10-01 | 3.1 | -3.73 | -40.5 |
| 1992-11-01 | 3.09 | -0.32 | -35.76 |
| 1992-12-01 | 2.92 | -5.5 | -34.09 |
| 1993-01-01 | 3.02 | 3.42 | -25.06 |
| 1993-02-01 | 3.03 | 0.33 | -25.37 |
| 1993-03-01 | 3.07 | 1.32 | -22.86 |
| 1993-04-01 | 2.96 | -3.58 | -20.64 |
| 1993-05-01 | 3 | 1.35 | -21.47 |
| 1993-06-01 | 3.04 | 1.33 | -19.15 |
| 1993-07-01 | 3.06 | 0.66 | -5.85 |
| 1993-08-01 | 3.03 | -0.98 | -8.18 |
| 1993-09-01 | 3.09 | 1.98 | -4.04 |
| 1993-10-01 | 2.99 | -3.24 | -3.55 |
| 1993-11-01 | 3.02 | 1 | -2.27 |
| 1993-12-01 | 2.96 | -1.99 | 1.37 |
| 1994-01-01 | 3.05 | 3.04 | 0.99 |
| 1994-02-01 | 3.25 | 6.56 | 7.26 |
| 1994-03-01 | 3.34 | 2.77 | 8.79 |
| 1994-04-01 | 3.56 | 6.59 | 20.27 |
| 1994-05-01 | 4.01 | 12.64 | 33.67 |
| 1994-06-01 | 4.25 | 5.99 | 39.8 |
| 1994-07-01 | 4.26 | 0.24 | 39.22 |
| 1994-08-01 | 4.47 | 4.93 | 47.52 |
| 1994-09-01 | 4.73 | 5.82 | 53.07 |
| 1994-10-01 | 4.76 | 0.63 | 59.2 |
| 1994-11-01 | 5.29 | 11.13 | 75.17 |
| 1994-12-01 | 5.45 | 3.02 | 84.12 |
| 1995-01-01 | 5.53 | 1.47 | 81.31 |
| 1995-02-01 | 5.92 | 7.05 | 82.15 |
| 1995-03-01 | 5.98 | 1.01 | 79.04 |
| 1995-04-01 | 6.05 | 1.17 | 69.94 |
| 1995-05-01 | 6.01 | -0.66 | 49.88 |
| 1995-06-01 | 6 | -0.17 | 41.18 |
| 1995-07-01 | 5.85 | -2.5 | 37.32 |
| 1995-08-01 | 5.74 | -1.88 | 28.41 |
| 1995-09-01 | 5.8 | 1.05 | 22.62 |
| 1995-10-01 | 5.76 | -0.69 | 21.01 |
| 1995-11-01 | 5.8 | 0.69 | 9.64 |
| 1995-12-01 | 5.6 | -3.45 | 2.75 |
| 1996-01-01 | 5.56 | -0.71 | 0.54 |
| 1996-02-01 | 5.22 | -6.12 | -11.82 |
| 1996-03-01 | 5.31 | 1.72 | -11.2 |
| 1996-04-01 | 5.22 | -1.69 | -13.72 |
| 1996-05-01 | 5.24 | 0.38 | -12.81 |
| 1996-06-01 | 5.27 | 0.57 | -12.17 |
| 1996-07-01 | 5.4 | 2.47 | -7.69 |
| 1996-08-01 | 5.22 | -3.33 | -9.06 |
| 1996-09-01 | 5.3 | 1.53 | -8.62 |
| 1996-10-01 | 5.24 | -1.13 | -9.03 |
| 1996-11-01 | 5.31 | 1.34 | -8.45 |
| 1996-12-01 | 5.29 | -0.38 | -5.54 |
| 1997-01-01 | 5.25 | -0.76 | -5.58 |
| 1997-02-01 | 5.19 | -1.14 | -0.57 |
| 1997-03-01 | 5.39 | 3.85 | 1.51 |
| 1997-04-01 | 5.51 | 2.23 | 5.56 |
| 1997-05-01 | 5.5 | -0.18 | 4.96 |
| 1997-06-01 | 5.56 | 1.09 | 5.5 |
| 1997-07-01 | 5.52 | -0.72 | 2.22 |
| 1997-08-01 | 5.54 | 0.36 | 6.13 |
| 1997-09-01 | 5.54 | 0 | 4.53 |
| 1997-10-01 | 5.5 | -0.72 | 4.96 |
| 1997-11-01 | 5.52 | 0.36 | 3.95 |
| 1997-12-01 | 5.5 | -0.36 | 3.97 |
| 1998-01-01 | 5.56 | 1.09 | 5.9 |
| 1998-02-01 | 5.51 | -0.9 | 6.17 |
| 1998-03-01 | 5.49 | -0.36 | 1.86 |
| 1998-04-01 | 5.45 | -0.73 | -1.09 |
| 1998-05-01 | 5.49 | 0.73 | -0.18 |
| 1998-06-01 | 5.56 | 1.28 | 0 |
| 1998-07-01 | 5.54 | -0.36 | 0.36 |
| 1998-08-01 | 5.55 | 0.18 | 0.18 |
| 1998-09-01 | 5.51 | -0.72 | -0.54 |
| 1998-10-01 | 5.07 | -7.99 | -7.82 |
| 1998-11-01 | 4.83 | -4.73 | -12.5 |
| 1998-12-01 | 4.68 | -3.11 | -14.91 |
| 1999-01-01 | 4.63 | -1.07 | -16.73 |
| 1999-02-01 | 4.76 | 2.81 | -13.61 |
| 1999-03-01 | 4.81 | 1.05 | -12.39 |
| 1999-04-01 | 4.74 | -1.46 | -13.03 |
| 1999-05-01 | 4.74 | 0 | -13.66 |
| 1999-06-01 | 4.76 | 0.42 | -14.39 |
| 1999-07-01 | 4.99 | 4.83 | -9.93 |
| 1999-08-01 | 5.07 | 1.6 | -8.65 |
| 1999-09-01 | 5.22 | 2.96 | -5.26 |
| 1999-10-01 | 5.2 | -0.38 | 2.56 |
| 1999-11-01 | 5.42 | 4.23 | 12.22 |
| 1999-12-01 | 5.3 | -2.21 | 13.25 |
| 2000-01-01 | 5.45 | 2.83 | 17.71 |
| 2000-02-01 | 5.73 | 5.14 | 20.38 |
| 2000-03-01 | 5.85 | 2.09 | 21.62 |
| 2000-04-01 | 6.02 | 2.91 | 27 |
| 2000-05-01 | 6.27 | 4.15 | 32.28 |
| 2000-06-01 | 6.53 | 4.15 | 37.18 |
| 2000-07-01 | 6.54 | 0.15 | 31.06 |
| 2000-08-01 | 6.5 | -0.61 | 28.21 |
| 2000-09-01 | 6.52 | 0.31 | 24.9 |
| 2000-10-01 | 6.51 | -0.15 | 25.19 |
| 2000-11-01 | 6.51 | 0 | 20.11 |
| 2000-12-01 | 6.4 | -1.69 | 20.75 |
| 2001-01-01 | 5.98 | -6.56 | 9.72 |
| 2001-02-01 | 5.49 | -8.19 | -4.19 |
| 2001-03-01 | 5.31 | -3.28 | -9.23 |
| 2001-04-01 | 4.8 | -9.6 | -20.27 |
| 2001-05-01 | 4.21 | -12.29 | -32.85 |
| 2001-06-01 | 3.97 | -5.7 | -39.2 |
| 2001-07-01 | 3.77 | -5.04 | -42.35 |
| 2001-08-01 | 3.65 | -3.18 | -43.85 |
| 2001-09-01 | 3.07 | -15.89 | -52.91 |
| 2001-10-01 | 2.49 | -18.89 | -61.75 |
| 2001-11-01 | 2.09 | -16.06 | -67.9 |
| 2001-12-01 | 1.82 | -12.92 | -71.56 |
| 2002-01-01 | 1.73 | -4.95 | -71.07 |
| 2002-02-01 | 1.74 | 0.58 | -68.31 |
| 2002-03-01 | 1.73 | -0.57 | -67.42 |
| 2002-04-01 | 1.75 | 1.16 | -63.54 |
| 2002-05-01 | 1.75 | 0 | -58.43 |
| 2002-06-01 | 1.75 | 0 | -55.92 |
| 2002-07-01 | 1.73 | -1.14 | -54.11 |
| 2002-08-01 | 1.74 | 0.58 | -52.33 |
| 2002-09-01 | 1.75 | 0.57 | -43 |
| 2002-10-01 | 1.75 | 0 | -29.72 |
| 2002-11-01 | 1.34 | -23.43 | -35.89 |
| 2002-12-01 | 1.24 | -7.46 | -31.87 |
| 2003-01-01 | 1.24 | 0 | -28.32 |
| 2003-02-01 | 1.26 | 1.61 | -27.59 |
| 2003-03-01 | 1.25 | -0.79 | -27.75 |
| 2003-04-01 | 1.26 | 0.8 | -28 |
| 2003-05-01 | 1.26 | 0 | -28 |
| 2003-06-01 | 1.22 | -3.17 | -30.29 |
| 2003-07-01 | 1.01 | -17.21 | -41.62 |
| 2003-08-01 | 1.03 | 1.98 | -40.8 |
| 2003-09-01 | 1.01 | -1.94 | -42.29 |
| 2003-10-01 | 1.01 | 0 | -42.29 |
| 2003-11-01 | 1 | -0.99 | -25.37 |
| 2003-12-01 | 0.98 | -2 | -20.97 |
| 2004-01-01 | 1 | 2.04 | -19.35 |
| 2004-02-01 | 1.01 | 1 | -19.84 |
| 2004-03-01 | 1 | -0.99 | -20 |
| 2004-04-01 | 1 | 0 | -20.63 |
| 2004-05-01 | 1 | 0 | -20.63 |
| 2004-06-01 | 1.03 | 3 | -15.57 |
| 2004-07-01 | 1.26 | 22.33 | 24.75 |
| 2004-08-01 | 1.43 | 13.49 | 38.83 |
| 2004-09-01 | 1.61 | 12.59 | 59.41 |
| 2004-10-01 | 1.76 | 9.32 | 74.26 |
| 2004-11-01 | 1.93 | 9.66 | 93 |
| 2004-12-01 | 2.16 | 11.92 | 120.41 |
| 2005-01-01 | 2.28 | 5.56 | 128 |
| 2005-02-01 | 2.5 | 9.65 | 147.52 |
| 2005-03-01 | 2.63 | 5.2 | 163 |
| 2005-04-01 | 2.79 | 6.08 | 179 |
| 2005-05-01 | 3 | 7.53 | 200 |
| 2005-06-01 | 3.04 | 1.33 | 195.15 |
| 2005-07-01 | 3.26 | 7.24 | 158.73 |
| 2005-08-01 | 3.5 | 7.36 | 144.76 |
| 2005-09-01 | 3.62 | 3.43 | 124.84 |
| 2005-10-01 | 3.78 | 4.42 | 114.77 |
| 2005-11-01 | 4 | 5.82 | 107.25 |
| 2005-12-01 | 4.16 | 4 | 92.59 |
| 2006-01-01 | 4.29 | 3.12 | 88.16 |
| 2006-02-01 | 4.49 | 4.66 | 79.6 |
| 2006-03-01 | 4.59 | 2.23 | 74.52 |
| 2006-04-01 | 4.79 | 4.36 | 71.68 |
| 2006-05-01 | 4.94 | 3.13 | 64.67 |
| 2006-06-01 | 4.99 | 1.01 | 64.14 |
| 2006-07-01 | 5.24 | 5.01 | 60.74 |
| 2006-08-01 | 5.25 | 0.19 | 50 |
| 2006-09-01 | 5.25 | 0 | 45.03 |
| 2006-10-01 | 5.25 | 0 | 38.89 |
| 2006-11-01 | 5.25 | 0 | 31.25 |
| 2006-12-01 | 5.24 | -0.19 | 25.96 |
| 2007-01-01 | 5.25 | 0.19 | 22.38 |
| 2007-02-01 | 5.26 | 0.19 | 17.15 |
| 2007-03-01 | 5.26 | 0 | 14.6 |
| 2007-04-01 | 5.25 | -0.19 | 9.6 |
| 2007-05-01 | 5.25 | 0 | 6.28 |
| 2007-06-01 | 5.25 | 0 | 5.21 |
| 2007-07-01 | 5.26 | 0.19 | 0.38 |
| 2007-08-01 | 5.02 | -4.56 | -4.38 |
| 2007-09-01 | 4.94 | -1.59 | -5.9 |
| 2007-10-01 | 4.76 | -3.64 | -9.33 |
| 2007-11-01 | 4.49 | -5.67 | -14.48 |
| 2007-12-01 | 4.24 | -5.57 | -19.08 |
| 2008-01-01 | 3.94 | -7.08 | -24.95 |
| 2008-02-01 | 2.98 | -24.37 | -43.35 |
| 2008-03-01 | 2.61 | -12.42 | -50.38 |
| 2008-04-01 | 2.28 | -12.64 | -56.57 |
| 2008-05-01 | 1.98 | -13.16 | -62.29 |
| 2008-06-01 | 2 | 1.01 | -61.9 |
| 2008-07-01 | 2.01 | 0.5 | -61.79 |
| 2008-08-01 | 2 | -0.5 | -60.16 |
| 2008-09-01 | 1.81 | -9.5 | -63.36 |
| 2008-10-01 | 0.97 | -46.41 | -79.62 |
| 2008-11-01 | 0.39 | -59.79 | -91.31 |
| 2008-12-01 | 0.16 | -58.97 | -96.23 |
| 2009-01-01 | 0.15 | -6.25 | -96.19 |
| 2009-02-01 | 0.22 | 46.67 | -92.62 |
| 2009-03-01 | 0.18 | -18.18 | -93.1 |
| 2009-04-01 | 0.15 | -16.67 | -93.42 |
| 2009-05-01 | 0.18 | 20 | -90.91 |
| 2009-06-01 | 0.21 | 16.67 | -89.5 |
| 2009-07-01 | 0.16 | -23.81 | -92.04 |
| 2009-08-01 | 0.16 | 0 | -92 |
| 2009-09-01 | 0.15 | -6.25 | -91.71 |
| 2009-10-01 | 0.12 | -20 | -87.63 |
| 2009-11-01 | 0.12 | 0 | -69.23 |
| 2009-12-01 | 0.12 | 0 | -25 |
| 2010-01-01 | 0.11 | -8.33 | -26.67 |
| 2010-02-01 | 0.13 | 18.18 | -40.91 |
| 2010-03-01 | 0.16 | 23.08 | -11.11 |
| 2010-04-01 | 0.2 | 25 | 33.33 |
| 2010-05-01 | 0.2 | 0 | 11.11 |
| 2010-06-01 | 0.18 | -10 | -14.29 |
| 2010-07-01 | 0.18 | 0 | 12.5 |
| 2010-08-01 | 0.19 | 5.56 | 18.75 |
| 2010-09-01 | 0.19 | 0 | 26.67 |
| 2010-10-01 | 0.19 | 0 | 58.33 |
| 2010-11-01 | 0.19 | 0 | 58.33 |
| 2010-12-01 | 0.18 | -5.26 | 50 |
| 2011-01-01 | 0.17 | -5.56 | 54.55 |
| 2011-02-01 | 0.16 | -5.88 | 23.08 |
| 2011-03-01 | 0.14 | -12.5 | -12.5 |
| 2011-04-01 | 0.1 | -28.57 | -50 |
| 2011-05-01 | 0.09 | -10 | -55 |
| 2011-06-01 | 0.09 | 0 | -50 |
| 2011-07-01 | 0.07 | -22.22 | -61.11 |
| 2011-08-01 | 0.1 | 42.86 | -47.37 |
| 2011-09-01 | 0.08 | -20 | -57.89 |
| 2011-10-01 | 0.07 | -12.5 | -63.16 |
| 2011-11-01 | 0.08 | 14.29 | -57.89 |
| 2011-12-01 | 0.07 | -12.5 | -61.11 |
| 2012-01-01 | 0.08 | 14.29 | -52.94 |
| 2012-02-01 | 0.1 | 25 | -37.5 |
| 2012-03-01 | 0.13 | 30 | -7.14 |
| 2012-04-01 | 0.14 | 7.69 | 40 |
| 2012-05-01 | 0.16 | 14.29 | 77.78 |
| 2012-06-01 | 0.16 | 0 | 77.78 |
| 2012-07-01 | 0.16 | 0 | 128.57 |
| 2012-08-01 | 0.13 | -18.75 | 30 |
| 2012-09-01 | 0.14 | 7.69 | 75 |
| 2012-10-01 | 0.16 | 14.29 | 128.57 |
| 2012-11-01 | 0.16 | 0 | 100 |
| 2012-12-01 | 0.16 | 0 | 128.57 |
| 2013-01-01 | 0.14 | -12.5 | 75 |
| 2013-02-01 | 0.15 | 7.14 | 50 |
| 2013-03-01 | 0.14 | -6.67 | 7.69 |
| 2013-04-01 | 0.15 | 7.14 | 7.14 |
| 2013-05-01 | 0.11 | -26.67 | -31.25 |
| 2013-06-01 | 0.09 | -18.18 | -43.75 |
| 2013-07-01 | 0.09 | 0 | -43.75 |
| 2013-08-01 | 0.08 | -11.11 | -38.46 |
| 2013-09-01 | 0.08 | 0 | -42.86 |
| 2013-10-01 | 0.09 | 12.5 | -43.75 |
| 2013-11-01 | 0.08 | -11.11 | -50 |
| 2013-12-01 | 0.09 | 12.5 | -43.75 |
| 2014-01-01 | 0.07 | -22.22 | -50 |
| 2014-02-01 | 0.07 | 0 | -53.33 |
| 2014-03-01 | 0.08 | 14.29 | -42.86 |
| 2014-04-01 | 0.09 | 12.5 | -40 |
| 2014-05-01 | 0.09 | 0 | -18.18 |
| 2014-06-01 | 0.1 | 11.11 | 11.11 |
| 2014-07-01 | 0.09 | -10 | 0 |
| 2014-08-01 | 0.09 | 0 | 12.5 |
| 2014-09-01 | 0.09 | 0 | 12.5 |
| 2014-10-01 | 0.09 | 0 | 0 |
| 2014-11-01 | 0.09 | 0 | 12.5 |
| 2014-12-01 | 0.12 | 33.33 | 33.33 |
| 2015-01-01 | 0.11 | -8.33 | 57.14 |
| 2015-02-01 | 0.11 | 0 | 57.14 |
| 2015-03-01 | 0.11 | 0 | 37.5 |
| 2015-04-01 | 0.12 | 9.09 | 33.33 |
| 2015-05-01 | 0.12 | 0 | 33.33 |
| 2015-06-01 | 0.13 | 8.33 | 30 |
| 2015-07-01 | 0.13 | 0 | 44.44 |
| 2015-08-01 | 0.14 | 7.69 | 55.56 |
| 2015-09-01 | 0.14 | 0 | 55.56 |
| 2015-10-01 | 0.12 | -14.29 | 33.33 |
| 2015-11-01 | 0.12 | 0 | 33.33 |
| 2015-12-01 | 0.24 | 100 | 100 |
| 2016-01-01 | 0.34 | 41.67 | 209.09 |
| 2016-02-01 | 0.38 | 11.76 | 245.45 |
| 2016-03-01 | 0.36 | -5.26 | 227.27 |
| 2016-04-01 | 0.37 | 2.78 | 208.33 |
| 2016-05-01 | 0.37 | 0 | 208.33 |
| 2016-06-01 | 0.38 | 2.7 | 192.31 |
| 2016-07-01 | 0.39 | 2.63 | 200 |
| 2016-08-01 | 0.4 | 2.56 | 185.71 |
| 2016-09-01 | 0.4 | 0 | 185.71 |
| 2016-10-01 | 0.4 | 0 | 233.33 |
| 2016-11-01 | 0.41 | 2.5 | 241.67 |
| 2016-12-01 | 0.54 | 31.71 | 125 |
| 2017-01-01 | 0.65 | 20.37 | 91.18 |
| 2017-02-01 | 0.66 | 1.54 | 73.68 |
| 2017-03-01 | 0.79 | 19.7 | 119.44 |
| 2017-04-01 | 0.9 | 13.92 | 143.24 |
| 2017-05-01 | 0.91 | 1.11 | 145.95 |
| 2017-06-01 | 1.04 | 14.29 | 173.68 |
| 2017-07-01 | 1.15 | 10.58 | 194.87 |
| 2017-08-01 | 1.16 | 0.87 | 190 |
| 2017-09-01 | 1.15 | -0.86 | 187.5 |
| 2017-10-01 | 1.15 | 0 | 187.5 |
| 2017-11-01 | 1.16 | 0.87 | 182.93 |
| 2017-12-01 | 1.3 | 12.07 | 140.74 |
| 2018-01-01 | 1.41 | 8.46 | 116.92 |
| 2018-02-01 | 1.42 | 0.71 | 115.15 |
| 2018-03-01 | 1.51 | 6.34 | 91.14 |
| 2018-04-01 | 1.69 | 11.92 | 87.78 |
| 2018-05-01 | 1.7 | 0.59 | 86.81 |
| 2018-06-01 | 1.82 | 7.06 | 75 |
| 2018-07-01 | 1.91 | 4.95 | 66.09 |
| 2018-08-01 | 1.91 | 0 | 64.66 |
| 2018-09-01 | 1.95 | 2.09 | 69.57 |
| 2018-10-01 | 2.19 | 12.31 | 90.43 |
| 2018-11-01 | 2.2 | 0.46 | 89.66 |
| 2018-12-01 | 2.27 | 3.18 | 74.62 |
| 2019-01-01 | 2.4 | 5.73 | 70.21 |
| 2019-02-01 | 2.4 | 0 | 69.01 |
| 2019-03-01 | 2.41 | 0.42 | 59.6 |
| 2019-04-01 | 2.42 | 0.41 | 43.2 |
| 2019-05-01 | 2.39 | -1.24 | 40.59 |
| 2019-06-01 | 2.38 | -0.42 | 30.77 |
| 2019-07-01 | 2.4 | 0.84 | 25.65 |
| 2019-08-01 | 2.13 | -11.25 | 11.52 |
| 2019-09-01 | 2.04 | -4.23 | 4.62 |
| 2019-10-01 | 1.83 | -10.29 | -16.44 |
| 2019-11-01 | 1.55 | -15.3 | -29.55 |
| 2019-12-01 | 1.55 | 0 | -31.72 |
| 2020-01-01 | 1.55 | 0 | -35.42 |
| 2020-02-01 | 1.58 | 1.94 | -34.17 |
| 2020-03-01 | 0.65 | -58.86 | -73.03 |
| 2020-04-01 | 0.05 | -92.31 | -97.93 |
| 2020-05-01 | 0.05 | 0 | -97.91 |
| 2020-06-01 | 0.08 | 60 | -96.64 |
| 2020-07-01 | 0.09 | 12.5 | -96.25 |
| 2020-08-01 | 0.1 | 11.11 | -95.31 |
| 2020-09-01 | 0.09 | -10 | -95.59 |
| 2020-10-01 | 0.09 | 0 | -95.08 |
| 2020-11-01 | 0.09 | 0 | -94.19 |
| 2020-12-01 | 0.09 | 0 | -94.19 |
| 2021-01-01 | 0.09 | 0 | -94.19 |
| 2021-02-01 | 0.08 | -11.11 | -94.94 |
| 2021-03-01 | 0.07 | -12.5 | -89.23 |
| 2021-04-01 | 0.07 | 0 | 40 |
| 2021-05-01 | 0.06 | -14.29 | 20 |
| 2021-06-01 | 0.08 | 33.33 | 0 |
| 2021-07-01 | 0.1 | 25 | 11.11 |
| 2021-08-01 | 0.09 | -10 | -10 |
| 2021-09-01 | 0.08 | -11.11 | -11.11 |
| 2021-10-01 | 0.08 | 0 | -11.11 |
| 2021-11-01 | 0.08 | 0 | -11.11 |
| 2021-12-01 | 0.08 | 0 | -11.11 |
| 2022-01-01 | 0.08 | 0 | -11.11 |
Code
I use the following code to get data from FRED and plot the data.
import pandas_datareader.data as web    # pandas 0.19.x and later
from datetime import datetime
file_mev = 'mev_inflation.txt'
def get_series(MEV, NAME):
    df =web.DataReader(MEV, "fred", start, end)
    df.columns=[NAME]
    df[NAME] = np.where(df[NAME]==0., np.nan, df[NAME])
    df.dropna(axis=0, inplace=True)
    df.to_excel('./data/%s.xlsx'%MEV) # need index which are dates
    with open(file_mev, 'w') as f:
        f.write("%s %s"%(MEV, NAME))
        f.write("\n")
        f.write("The max happens on %s"%df.idxmax())
        f.write("\n")
        f.write("The min happens on %s"%df.idxmin())
        f.write("\n")
    print(df.head())
    print(df.tail())
    print("The max happens on ", df.idxmax())
    print(df.loc[df.idxmax()])
    print("The min happens on ", df.idxmin())
    print(df.loc[df.idxmin()])
    return df